A recruiter sends you a Slack message on Tuesday morning. They need a salary range for a Senior Software Engineer role in San Francisco by Friday. You open your survey portal and find three matches in your peer cut. Two of them are clearly the wrong job, and the data is from last year.
If you work on compensation benchmarking, you know that paid surveys (Mercer, Radford, and Willis Towers Watson) and comp platforms such as Pave are the baseline. Most comp committees expect a citation from one of them. However, the data they publish lags the market by quarters, and the subscriptions cost more than most companies can justify.
Public job postings provide that data. Pay-transparency laws in more than a dozen US states (California, Colorado, New York, Washington, Illinois, and others) now require employers to post pay ranges directly in the job posting. Real-time comp platforms such as Comprehensive.io are already built on this same data. You can collect it yourself, automatically.
You can build a multi-source comp benchmarking dataset that refreshes on a schedule, for any role you need to track. A single-source draft takes a few hours, and a multi-source benchmark takes a day or two if you are comfortable with spreadsheets. The output complements your survey stack instead of replacing it. It works best for analysts who are building their own pay bands and for comp committees that already accept directional data alongside Radford or Mercer.
Why traditional compensation benchmarking is breaking
The traditional approach works in principle, but breaks down for the following reasons:
- Survey data is months out of date by the time you see it. Annual surveys are collected once, aggregated, and published months later. As a result, the data that a comp analyst sees in Q2 reflects market conditions from the previous year. In rapidly evolving fields such as AI engineering or forward-deployed engineering, the lag is significant. For example, the Forward Deployed Engineer market price in May 2026 is not what it was in October 2025.
- Niche roles have sparse coverage. A peer-group cut with 40 data points for "Senior AI Engineer in Austin" has confidence intervals wide enough that you risk losing the candidate or overpaying significantly. Standard surveys catalog hundreds of job titles, but they lack detailed coverage of every emerging role across every metro that a comp team needs to price.
- The cost is prohibitive for most companies. A full Radford subscription is typically priced in the five-figure range, and the exact figure scales by company size and scope of cuts. Mercer and Willis Towers Watson are priced similarly. For a 200-person startup, paying for a single data source takes a meaningful share of a comp lead's salary. Most companies under Series C cannot justify that cost.
The data that is missing from surveys is published on public job boards, comp platforms, and company career sites. The challenge is to collect that data at scale.
What public sources publish
There are three useful source categories. Each has different biases, so cross-check across them instead of relying on just one.
| Source | What it offers |
|---|---|
| Job boards with posted salary (Indeed and LinkedIn) | The aggregators host job postings from many employers, including the salary range when the employer chooses to publish one. Pay-transparency laws in the more than a dozen states cited earlier require employers to publish salary ranges. As a result, more employers publish ranges in those states than in states without these laws. Coverage is strongest for postings that target those states. |
| Crowdsourced comp platforms (Levels.fyi, Glassdoor, and PayScale) | Employees self-report base, stock, and bonus. This is where total compensation (the number candidates are actually comparing your offer against) appears. For tech roles, Levels.fyi is the most useful source because it captures the stock and bonus components that posted ranges almost never include. |
| Direct from career sites (Workday, Greenhouse, Ashby, and Lever) | The same job posting that appears on Indeed and LinkedIn is also published on the employer's own career site, in the structured format that their applicant tracking system uses. Collecting directly from career sites yields the simplest data structure because the data passes through fewer intermediaries. |
Career-site terms of service vary by ATS (applicant tracking system), and some enforce automated-access restrictions more aggressively than others. Check the specific ATS before treating career-site scraping as a default.
Build a refreshable compensation dataset with Apify (step-by-step)
The walkthrough uses a Senior Software Engineer in San Francisco as the demo role. California pay-transparency law has been active since January 1, 2023, so career-site postings include actual ranges, and the demo will return a dataset that you can verify.
Apify is a platform of pre-built Actors (automation tools for AI) that handle the source-specific data collection work, and they are priced per result instead of per seat. The Actors used in this guide all run from Apify Console with no code, or via the API for an automated pipeline.
Actors have access to platform features such as built-in proxy management, anti-bot evasion support, integrated storage with structured CSV/Excel/JSON exports, and standardized input parameters (URLs, keywords, limits, etc.). Actors integrate easily with tools like Make, n8n, or AI workflows, so you can send your data directly into analysis pipelines without manual handling.
Step 1: The quick start
If this is your first Apify run, the steps in Apify Console are:
- Create an Apify account at apify.com if you do not have one. The Free plan starts with $5 in usage credit and no credit card; the Starter plan is $29 a month with $29 in credits.
- Open the Career Site Job Listing API Actor in Apify Store and click Try for free.
- Set the following 5 inputs in either Form view (each field) or JSON view (paste the JSON block).
- Click Save & Start. For 300 jobs the run finishes in less than a minute.
Use one source, one role, and one city. The goal is a usable first result in one session.
The input JSON:
{
  "timeRange": "6m",
  "limit": 300,
  "includeAi": true,
  "titleSearch": ["Senior Software Engineer"],
  "locationSearch": ["San Francisco, California, United States"]
}
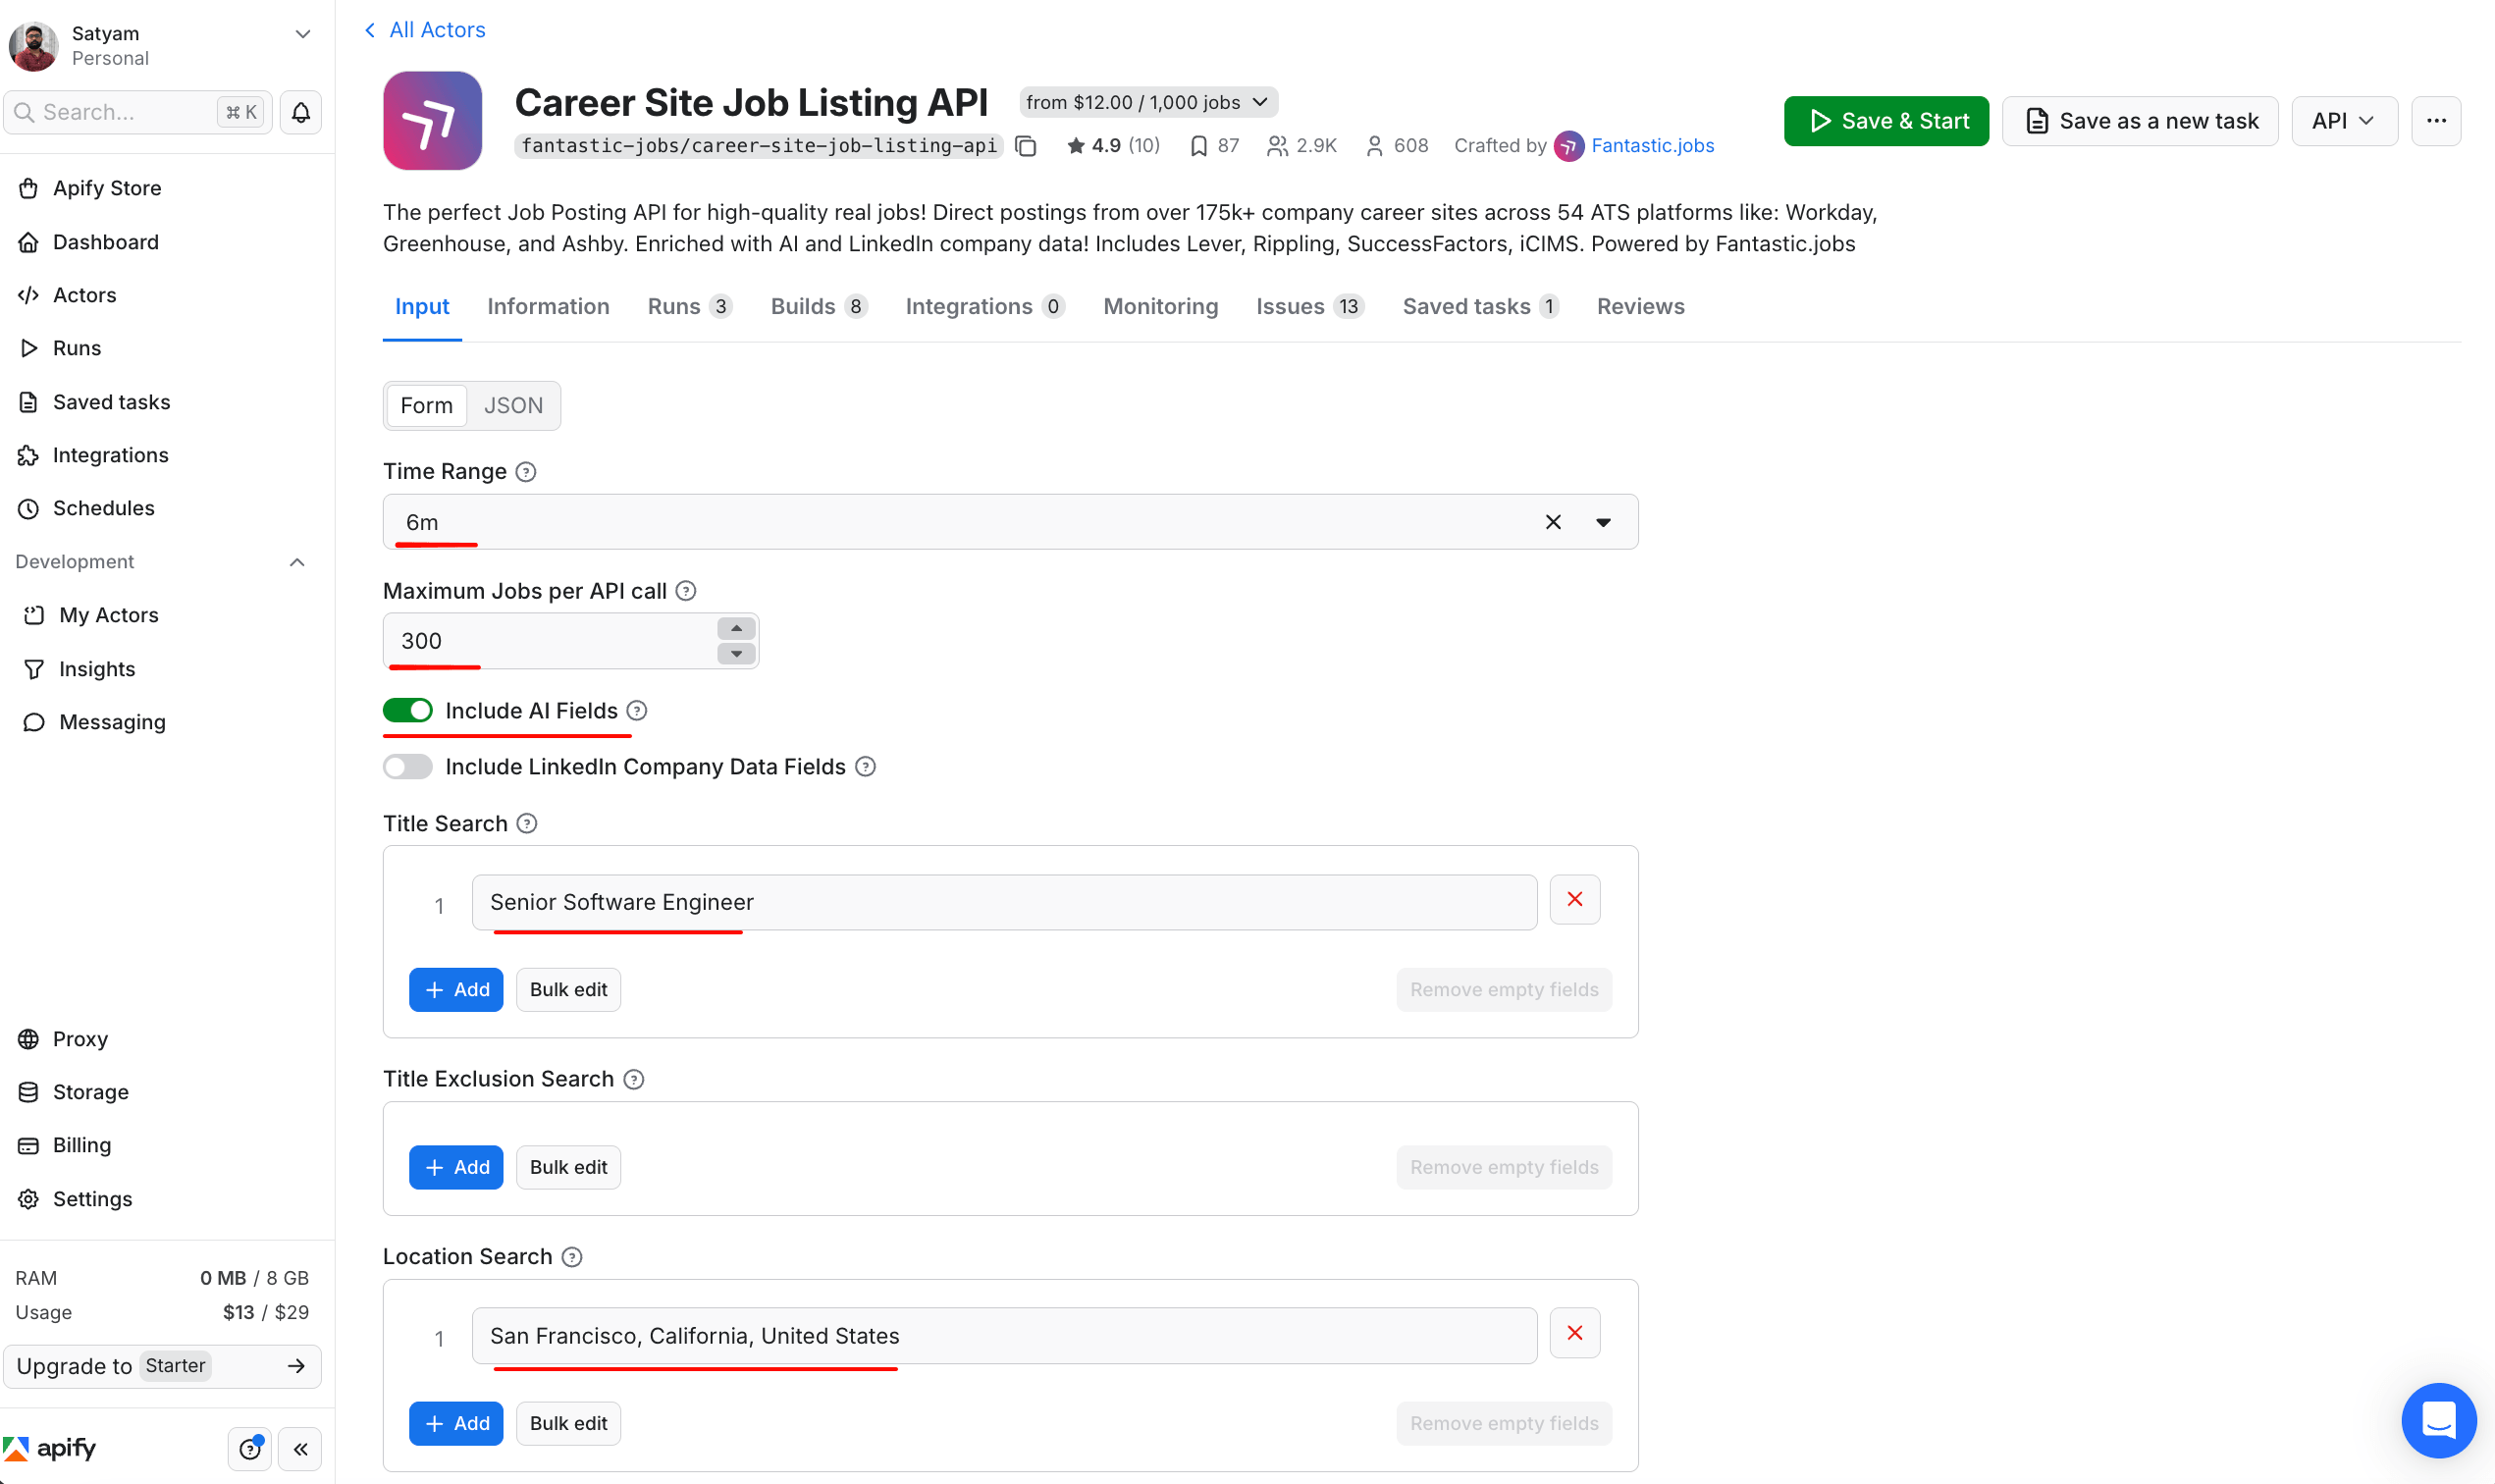
The same 5 inputs from the JSON block above, configured in the Actor's Form view. The Input tab exposes a Form / JSON toggle at the top, so the JSON snippet above pastes directly into JSON mode, or each field can be set in Form mode if your team prefers a no-code interface. Save & Start runs the configured input immediately; Save as a new task stores the configuration as a reusable task for scheduling later.
timeRange: "6m" is the backfill option that returns all currently active jobs. includeAi: true enables the AI-enriched salary fields, which recovers ranges that the structured salary_raw field does not contain.
A run on this exact input returns 300 active postings. Of those, 50 have a structured salary_raw field (all from Ashby, whose ATS publishes salary in structured form more reliably than Greenhouse, Workday, or Lever). The AI extraction recovers another 223 ranges from descriptions in the other ATSes. Total coverage is 273 out of 300 (91%).
The AI-extracted rows are a beta feature on the Actor. In our run, precision was about 88%. That number comes from checking the 43 records that had both structured salary_raw and an AI-extracted range, and counting how often the two agreed within 5 percent. (Those 43 are part of the 50 structured records; the 223 AI-only records are separate from these, so the 273 total does not double-count.)
Common failure modes to spot-check include a sign-on bonus reported as base, the target-comp number reported as the posted range, and total cash reported as base-only. Before bringing AI-extracted rows to a comp committee, spot-check 10-15 rows against the underlying job descriptions to catch these.
A single record looks like this:
{
  "title": "Senior Software Engineer",
  "organization": "Paradigm",
  "locations_derived": ["San Francisco, California, United States"],
  "salary_raw": {
    "currency": "USD",
    "value": {
      "minValue": 250000,
      "maxValue": 300000,
      "unitText": "YEAR"
    }
  },
  "source": "ashby",
  "url": "<https://jobs.ashbyhq.com/paradigmai/>..."
}
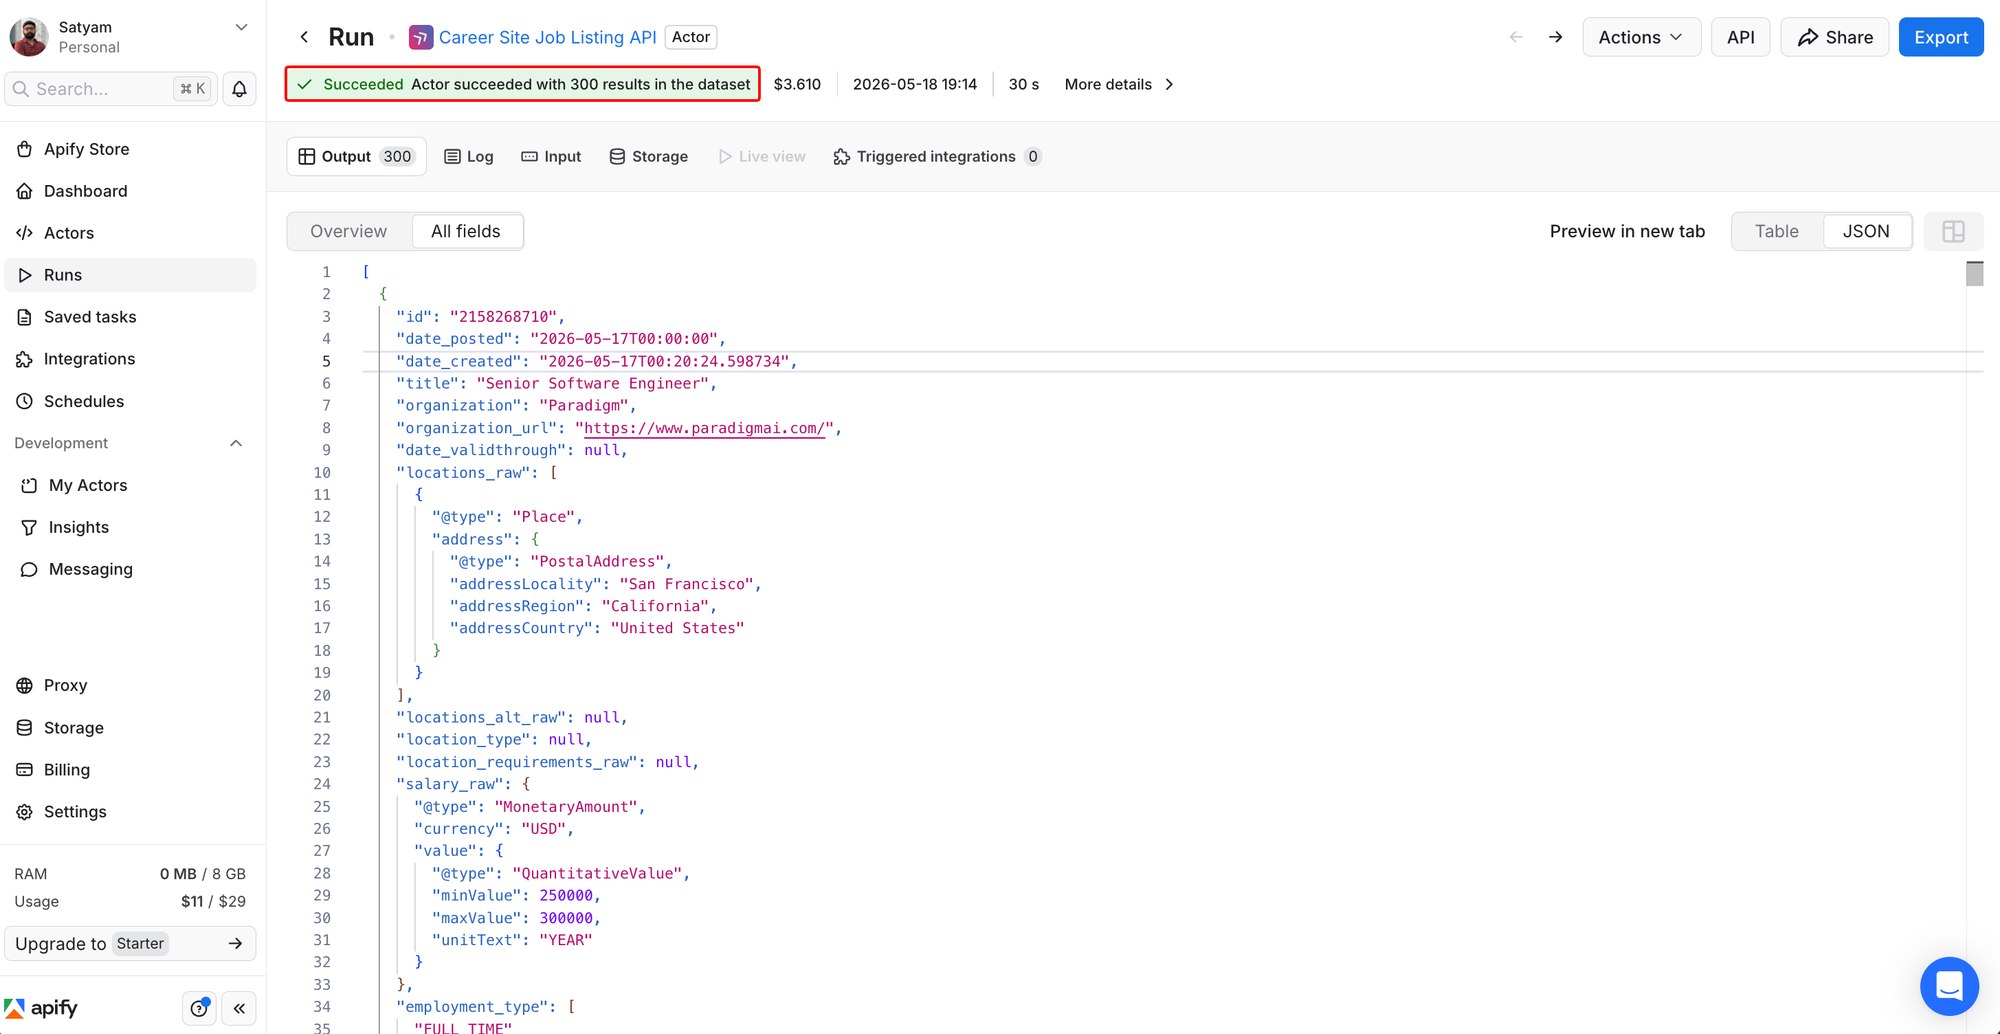
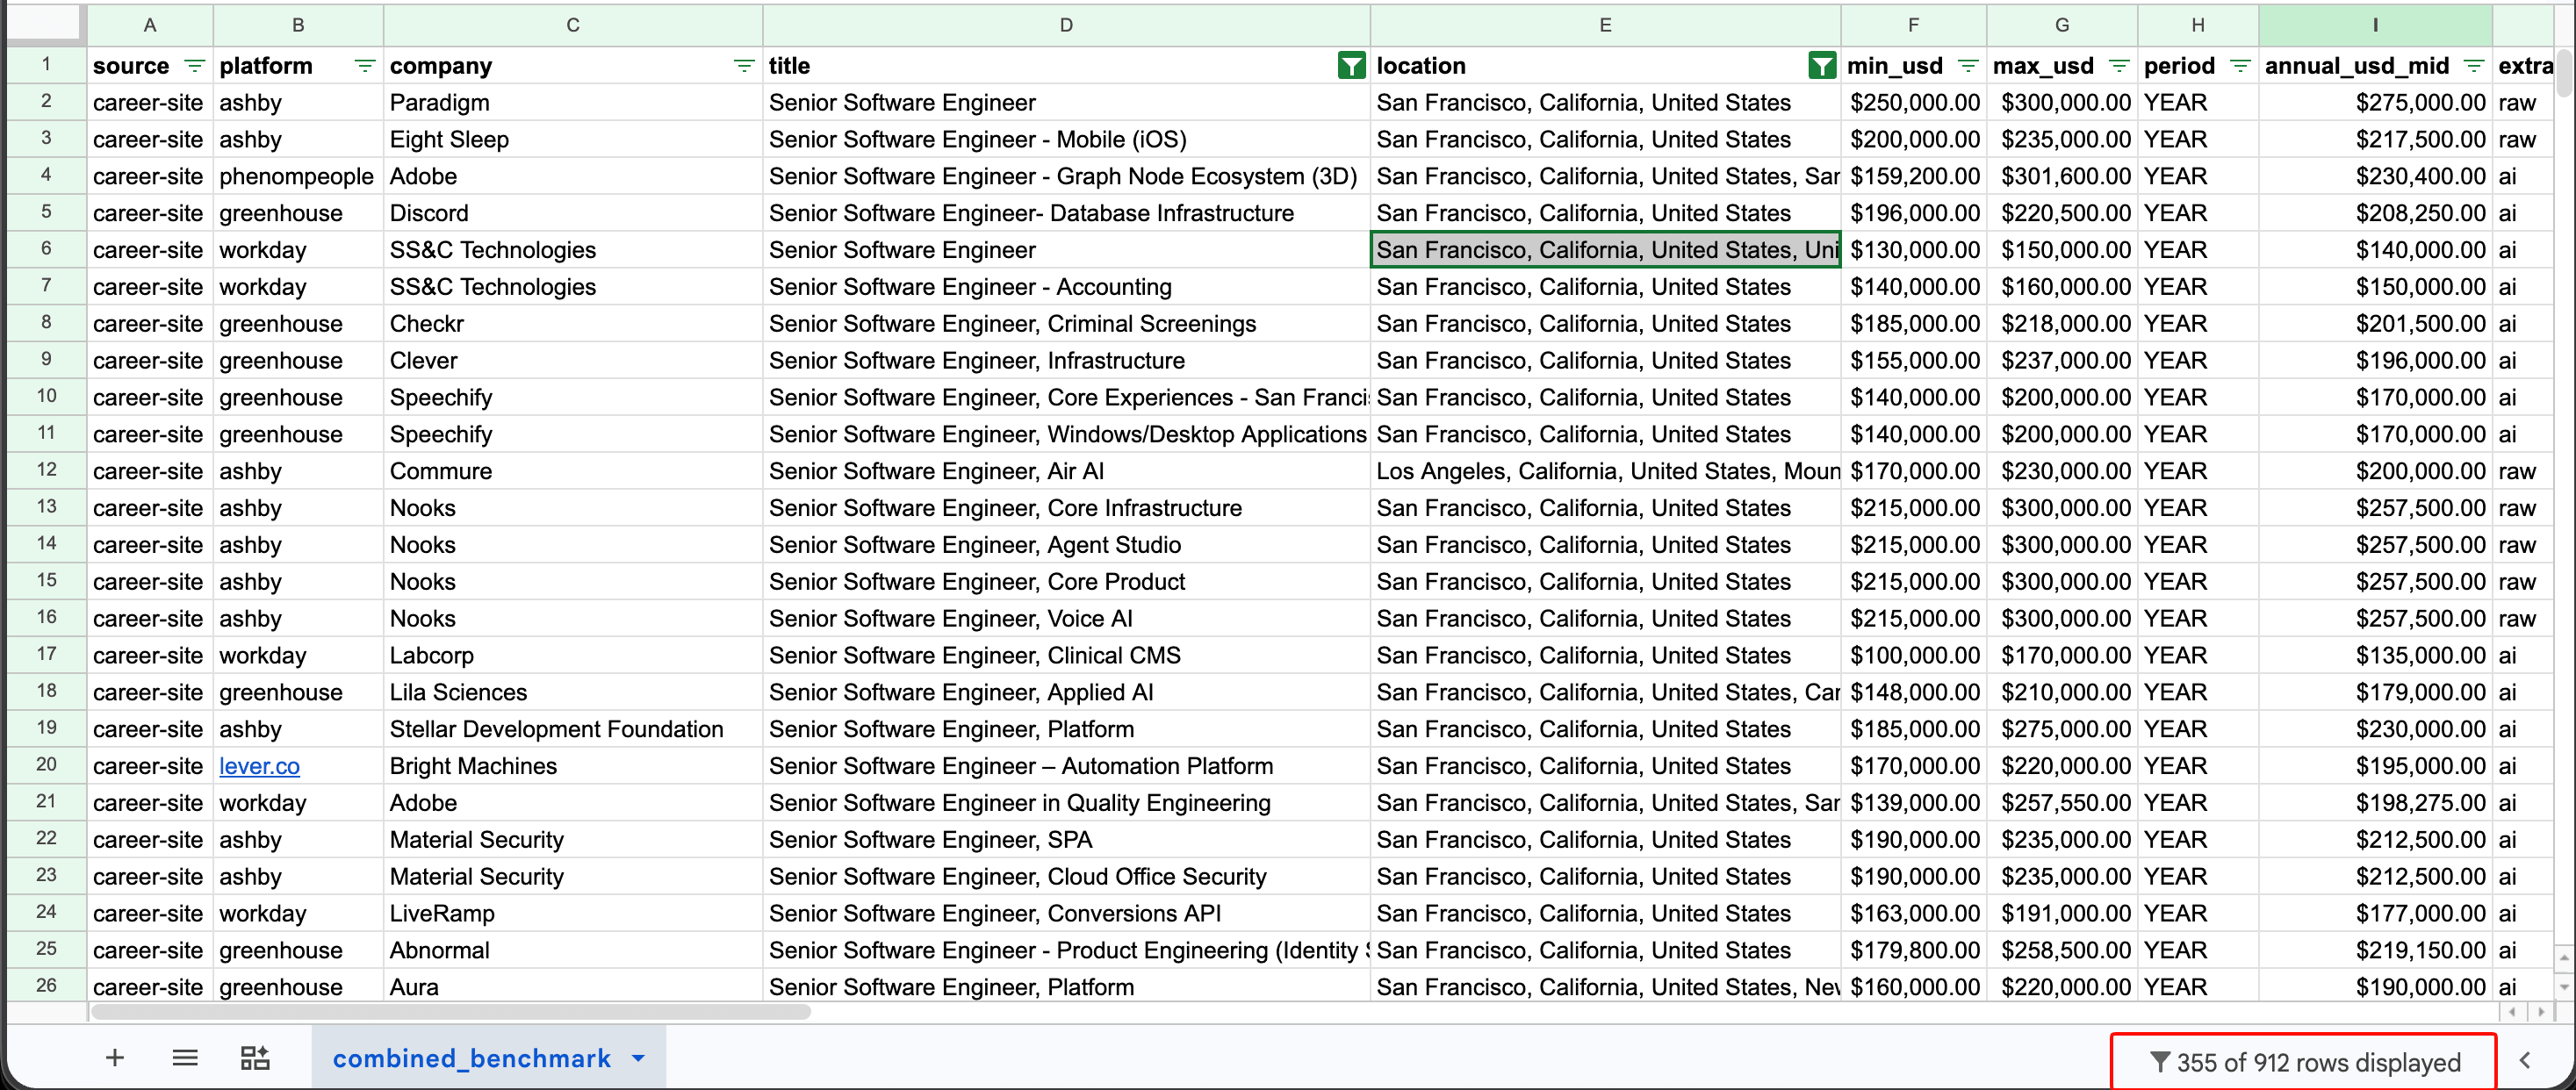
The run page after the Actor completes. 300 results in the dataset, $3.61 cost (matching the $3.60 estimate, since pricing is per 1,000 records). The Output tab's JSON view shows one record from Paradigm with the structured salary_raw field set to $250,000 to $300,000 a year. The Export button at the top right exports the full dataset to CSV.
Export the dataset to CSV and import it into a Google Sheet. Apify flattens the nested salary fields into separate columns (salary_raw/value/minValue and salary_raw/value/maxValue), so add a midpoint column with =AVERAGE of the two, then compute the P50 with =PERCENTILE.INC on the midpoint range. The cost on the Free or Starter plan is about $3.60 (300 jobs at $12 per 1,000). On Scale ($199/month subscription), it drops to ~$1.80; on Business ($999/month), it drops to $1.20. Plan for an hour or two for a careful first walkthrough, including signup, the first run, and spot-checking AI-extracted rows.
If you stop here, you already have a usable single-source benchmark. Steps 2 through 7 add more sources for cross-validation.
Step 2: All Jobs Actor across multiple sources
The career-site data is structured but limited to companies whose ATS exposes salary cleanly. To widen the sample with aggregator coverage in a single call, use the All Jobs Actor. It queries Indeed, LinkedIn, and Glassdoor at once, returns parsed numeric salary fields (salary_minimum, salary_maximum, salary_period, salary_currency), and normalizes currency.
The input config:
{
  "keyword": "Senior Software Engineer",
  "country": "United States",
  "location": "San Francisco",
  "max_results": 300,
  "job_type": "fulltime",
  "currency": "USD"
}
On the demo input, the Actor pulled 533 records across the 3 platforms. 414 of them (78%) have salary fields populated. The cost is about $1.50 (533 records at $2.80 per 1,000 on Free), and it scales down slightly on Starter and higher plans.
The schema is easier to work with than the per-source Actors because the salary field is already parsed as numeric values across all three sources.
Step 3: Indeed for volume signal and cross-check
If you want a dedicated Indeed pull alongside the multi-source scraper for more records per query, the Indeed Scraper returns Indeed-specific posting details, including salary as a single string field:
{
  "positionName": "Senior Software Engineer",
  "company": "...",
  "location": "San Francisco, CA",
  "salary": "$193,300 - $261,500 a year",
  "jobType": ["Full-time"],
  "postedAt": "Posted 3 days ago"
}
Of the 200 listings pulled, 194 had salary (97%). For senior tech roles in a pay-transparency state, Indeed's salary coverage is high. For other titles or other states, it is sparser. Use Indeed to confirm the cleaner sources. Do not use it as your primary salary source.
You parse the salary string with a regex:
import re

def parse_indeed_salary(s):
    if not s:
        return None
    numbers = re.findall(r"\\$([\\d,]+(?:\\.\\d+)?)", s)
    if len(numbers) < 2:
        return None
    mn = float(numbers[0].replace(",", ""))
    mx = float(numbers[1].replace(",", ""))
    if "hour" in s.lower():
        period = "HOUR"
    elif "year" in s.lower():
        period = "YEAR"
    else:
        period = "YEAR" if mn > 1000 else "HOUR"
    return mn, mx, period
Step 4: LinkedIn for the cleaner structured-pay field
LinkedIn job postings include a salaryInsights object when the employer fills it in, which gives you parsed base-salary numbers without any text parsing. The LinkedIn Jobs Scraper takes a search URL as input:
{
  "urls": ["<https://www.linkedin.com/jobs/search/?keywords=Senior+Software+Engineer&location=San+Francisco>"],
  "count": 100
}
Each returned record has two salary fields that you can use:
{
  "title": "Senior Full-stack Software Engineer",
  "companyName": "Kettle",
  "location": "San Francisco, CA",
  "salary": "$140,000.00/yr - $180,000.00/yr",
  "salaryInsights": {
    "compensationBreakdown": [{
      "minSalary": "140000.0",
      "maxSalary": "180000.0",
      "payPeriod": "YEARLY",
      "currencyCode": "USD",
      "compensationType": "BASE_SALARY"
    }],
    "compensationSource": "JOB_POSTER_PROVIDED"
  }
}
The salaryInsights object is the cleaner one. It gives you parsed numbers, currency code, pay period, and the compensation type (BASE_SALARY vs other components). Prefer it over the salary string. The parse is two lines:
def parse_linkedin_insights(insights):
    c = insights["compensationBreakdown"][0]
    return float(c["minSalary"]), float(c["maxSalary"])
LinkedIn salary coverage in this run was 32 out of 100 (32%). The salary field is filled in by the employer; LinkedIn does not enforce it. Coverage is therefore strongest where pay-transparency laws apply, and it is uneven elsewhere. The Actor itself has a 1,000-result cap per search; the workaround is to split a search by city if you need more.
Step 5: Glassdoor for pre-computed percentiles
The Glassdoor Scraper (PPR) is different from the per-job-row Actors. Set command: "salaries" and pass a Glassdoor salaries URL (for example, https://www.glassdoor.com/Salaries/san-francisco-senior-software-engineer-salary-SRCH_IL.0,13_IM759_KO14,38.htm). The Actor returns pre-aggregated percentiles (P10, P25, P50, P75, and P90) at two levels. The role-and-metro view gives base pay, additional pay (bonus and stock combined), and total pay percentiles for the overall query. The per-employer view gives total pay percentiles for the top companies in that query.
A single live run on that URL at the time of publication returned the following Senior Software Engineer percentiles for the San Francisco metro: base P50 $186k, additional pay P50 $93k, total pay P50 $280k. The per-employer view returned 3,518 salary records across 2,983 employers, and Uber's bucket showed total pay P50 $340k (N=2,108). Glassdoor refreshes these aggregates as new submissions arrive, so the exact numbers will drift over time.
Do not mix Glassdoor's pre-aggregated percentiles with per-job rows from the other sources in one P25/P50/P75 calculation. Glassdoor's P50 already represents the median of many individual data points. Counting it as one row alongside individual Indeed records double-counts. Keep Glassdoor's percentile output in its own sheet and use it as a cross-check on the per-job percentiles that you compute yourself.
Pricing on the Free plan is $4.75 per 1,000 results (Starter and higher plans do not show a discount on this Actor).
Step 6: Levels.fyi for tech total comp
For tech roles, posted-range sources give you base pay only. They do not capture stock or bonus. For a Senior Software Engineer at a big-tech company, base might be $230,000 but total compensation could be $555,000 once stock and bonus are included. If you benchmark using posted ranges alone for tech, you will underestimate total compensation by a factor of two or more.
The Levels.fyi Salary Scraper captures those missing fields. Configure it for the companies that you want to benchmark against:
{
  "mode": "specific",
  "companies": ["google", "meta", "apple", "openai", "anthropic",
                "stripe", "airbnb", "databricks", "plaid", "uber"],
  "roles": ["software-engineer"],
  "maxResults": 500
}
This input produced 500 individual offers with structured fields. One of them looks like this:
{
  "company": "Meta",
  "level": "E5",
  "yearsOfExperience": 5,
  "location": "Menlo Park, CA",
  "baseSalary": 230000,
  "stockGrantAnnual": 300000,
  "bonusAnnual": 40000,
  "totalCompensation": 570000,
  "currency": "USD"
}
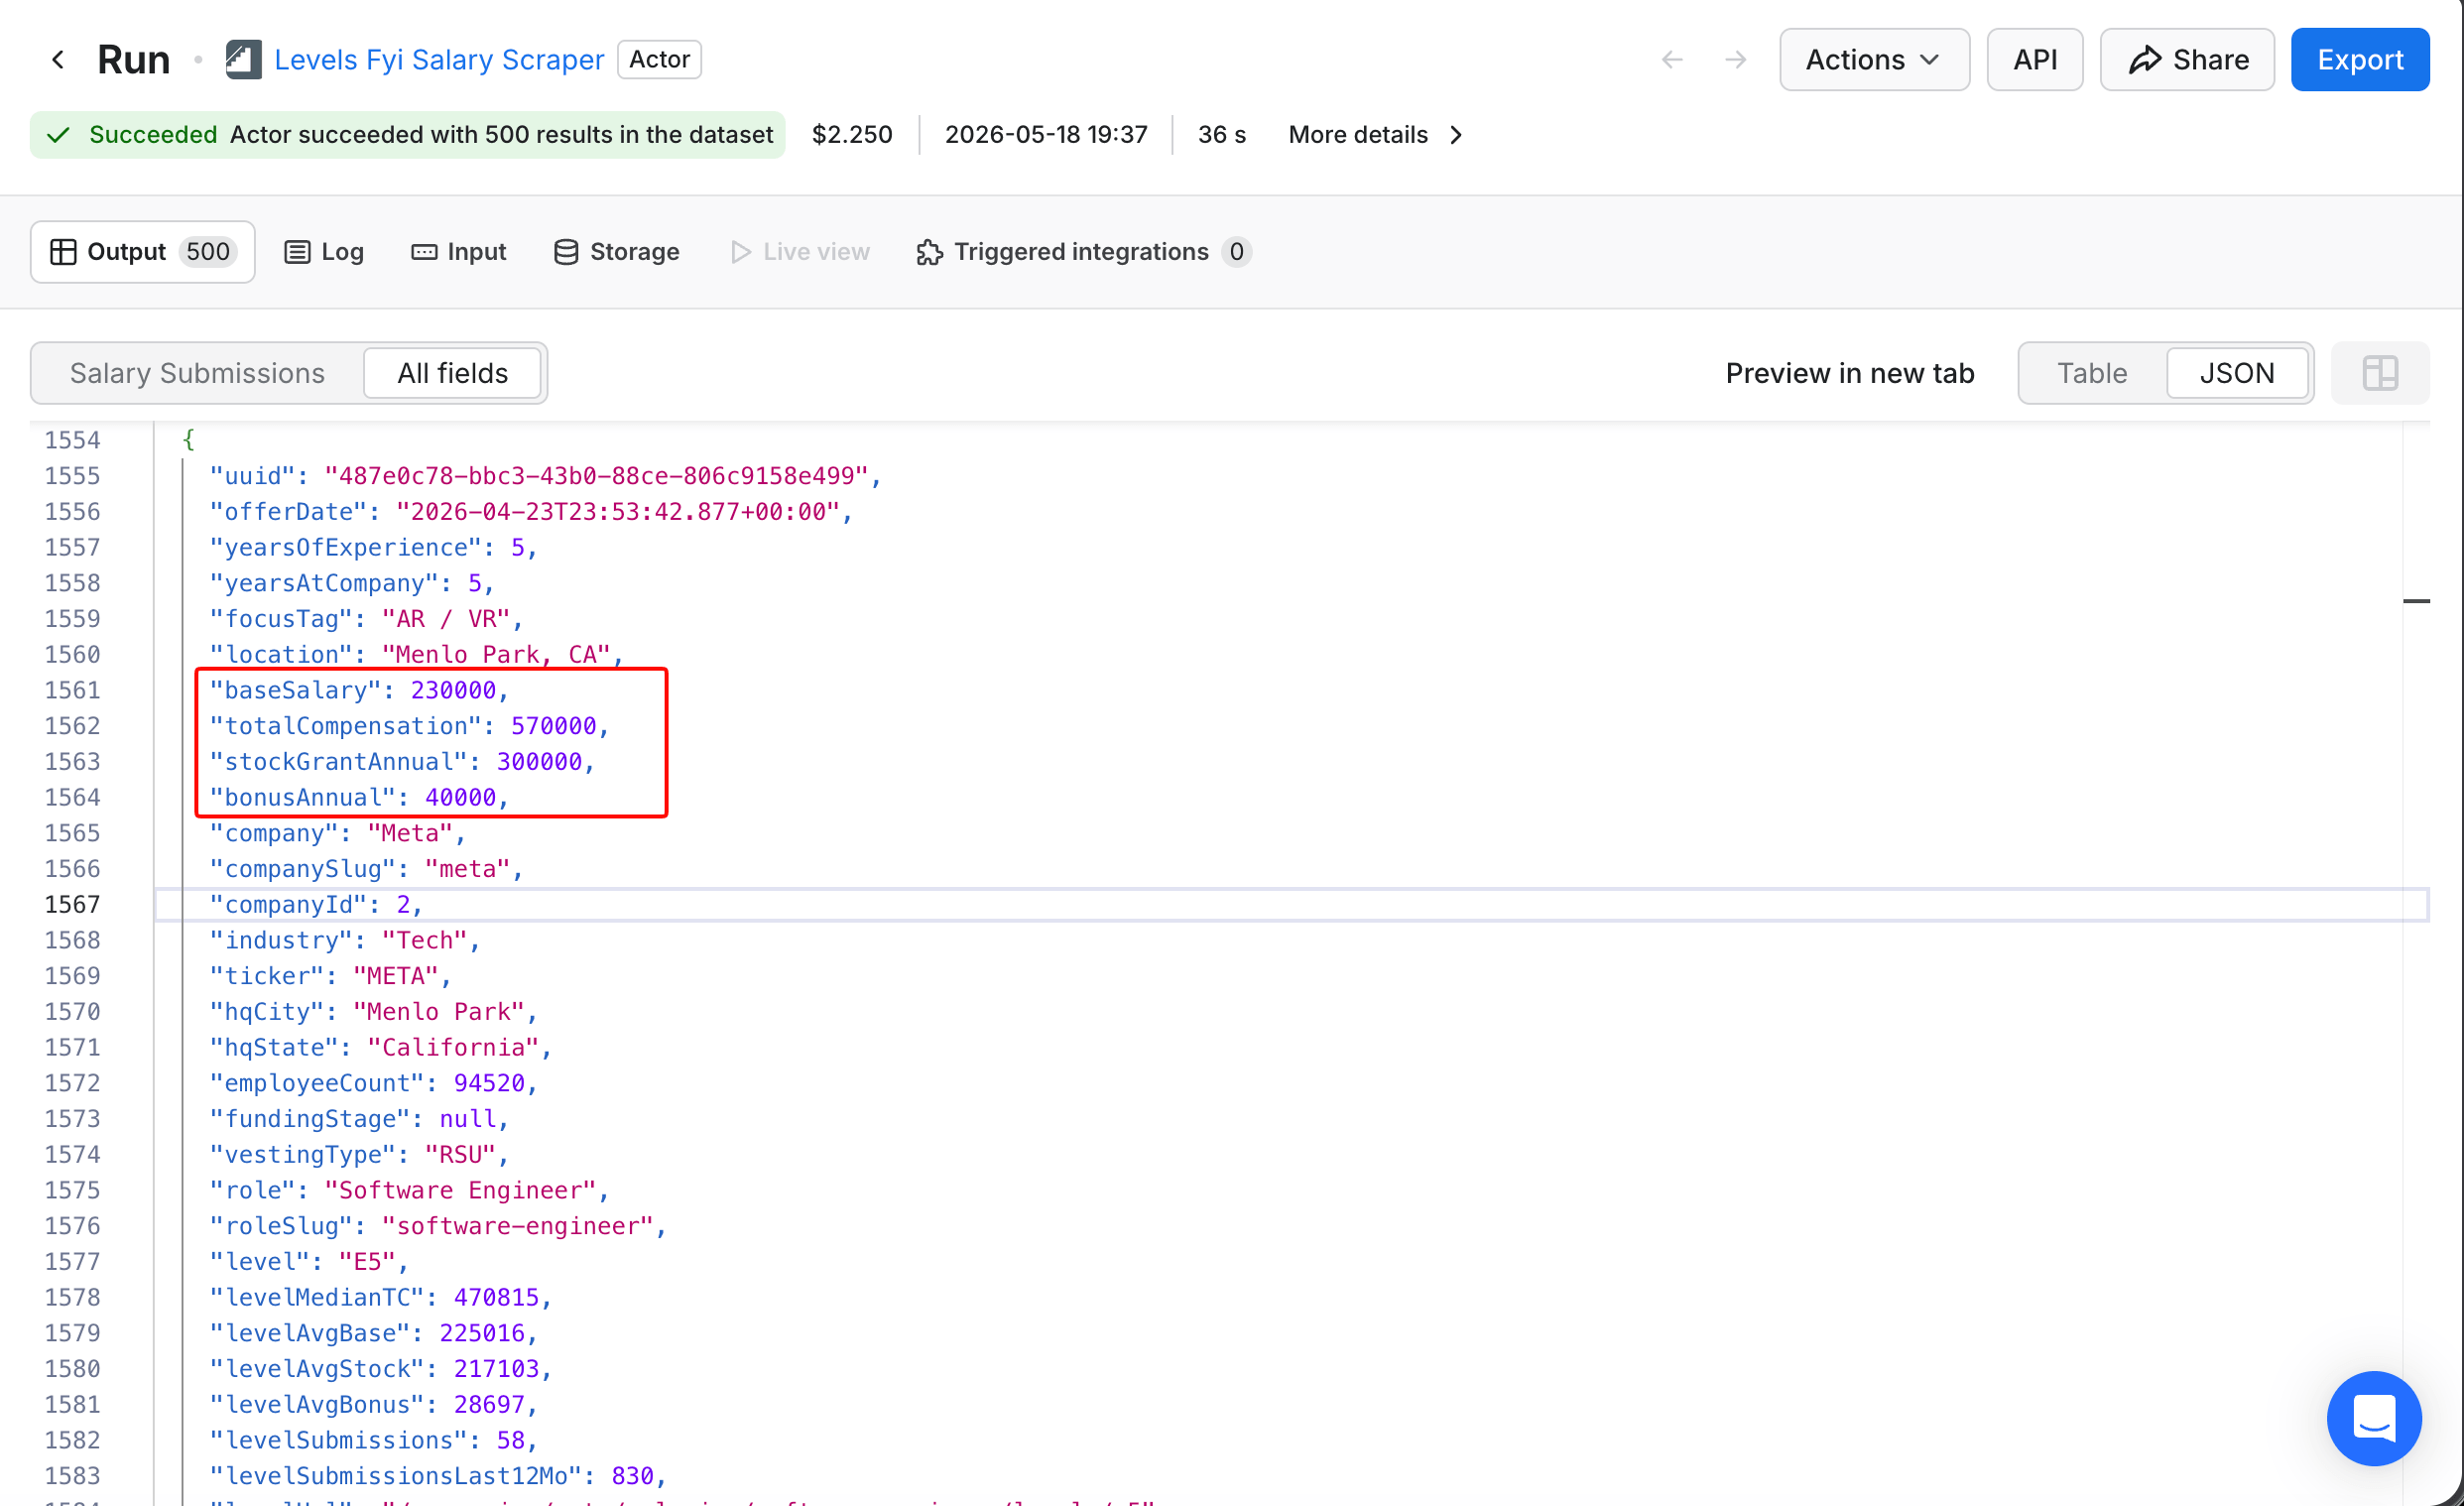
Meta's E5 is the equivalent of Google's L5; both mean Senior Software Engineer in each company's leveling system. The 4 boxed fields are the structured comp breakdown that posted-range Actors do not capture: base, total comp, stock, and bonus as separate fields. This single record's baseSalary of $230,000 matches the article's headline P50. The aggregate medians cited next (roughly $230,000 base, roughly $555,000 total comp) come from filtering the full 500-record dataset down to Senior-level roles in the SF Bay Area, which yields around 140 to 150 records depending on the exact filter.
Filter the result to Senior-level roles (L4 through L6 on Google-style ladders, E5 through E7 at Meta) in the SF Bay Area. Around 140 to 150 records match, depending on how strictly you draw the level and metro boundaries. Base P50 is roughly $230,000 and total comp P50 is roughly $555,000. The base figure matches the posted-range sources almost exactly. The total comp figure is what the candidate is comparing your offer against.
The cost on the Free plan is about $2.25 for the 500 records (at $4.50 per 1,000), and Starter and higher Apify plans discount this. The Actor has a smaller user base than the other sources used in this guide (around 10 users when this guide was published), so treat it as a newer, less proven option and verify the output for your own role before relying on it in a recurring pipeline.
Step 7: PayScale for non-tech and non-US roles
Steps 1 through 6 cover the primary stack. PayScale is useful only when the other sources have sparse coverage, which mainly happens for non-tech roles or markets outside the US. The PayScale Salary Scraper covers 9 countries (US, Canada, UK, Australia, India, Germany, France, Netherlands, and Singapore) and 29 job categories. It provides pre-computed percentiles that are broken down by experience, location, skills, and gender.
At the time of publication, this Actor had 4 total users and no reviews. Use it for the cases that the other sources do not cover well (non-tech roles outside the US, where Levels.fyi has no coverage and posted-range aggregators are sparse). Free or Starter pricing is around $8.00 per 1,000 records, second only to the career-site Actor in this stack.
Turn the raw data into a benchmark
You now have 4 or 5 JSON datasets with different schemas.
Normalize the salary field
Your data comes in three salary formats:
- Raw text (Indeed, LinkedIn
salarystring) - Parsed numeric (career-site
salary_raw, all-jobssalary_minimum/salary_maximum, LinkedInsalaryInsights, and Levels.fyibaseSalary) - Pre-aggregated percentiles (Glassdoor
occSalaryResponseandaggregateSalaryResponse, PayScale percentile output)
Convert everything in categories (1) and (2) to annualized base USD. Pay-transparency states sometimes produce wide ranges (a "$80,000 to $300,000" posting is the employer's way of complying with the law without providing useful information). Flag postings where (max - min) / min > 1.0 and weight tighter ranges more heavily, or drop the wide ones if you have enough other data.
Keep category (3), the pre-aggregated percentiles from Glassdoor and PayScale, in a separate sheet. Use it as a cross-check instead of as input rows to your own percentile math.
The target schema for the merged per-job dataset is the same 11 columns regardless of which Actor produced the row: source, platform, company, title, location, min_usd, max_usd, period, annual_mid, extraction, url. The extraction field flags whether the row's salary came from a structured field (raw) or AI extraction (ai), so you can filter for the spot-checks that are recommended in Step 1.
Each row's source field records which Actor it came from (career-site, all-jobs, indeed, linkedin), which makes cross-source filtering and dedup straightforward. Dedup by (company, title, location) to collapse the same job that is posted to multiple boards. On collisions, prefer rows in this order: career-site, LinkedIn salaryInsights, all-jobs parsed, Indeed regex, then AI-extracted.
The normalization logic for all four per-job sources follows the same shape. The core function:
def normalize_period(amount_min, amount_max, period):
    """Convert a posted range to annual USD midpoint."""
    if not (amount_min and amount_max):
        return None
    mid = (amount_min + amount_max) / 2
    if period and period.upper() in ("YEAR", "YEARLY", "ANNUAL"):
        return mid
    if period and period.upper() in ("HOUR", "HOURLY"):
        return mid * 2080  # 40h x 52w
    if period and period.upper() in ("MONTH", "MONTHLY"):
        return mid * 12
    # Heuristic when period missing: under 1000 is almost certainly hourly
    if mid < 1000:
        return mid * 2080
    if mid < 50000:
        return mid * 12
    return mid
The spreadsheet-only path
If you do not run Python, rely on the two Actors that return parsed numeric salary fields directly. Both fantastic-jobs/career-site-job-listing-api (Step 1) and agentx/all-jobs-scraper (Step 2) export min, max, period, and currency as separate columns once you export to CSV. Apify flattens the nested JSON keys that you see in the run preview into dotted column names such as salary_raw/value/minValue, so you can pivot percentiles in Google Sheets with no parsing step.
For the Indeed rows that are returned as raw text (Step 3), extract with REGEXEXTRACT. Place the raw Indeed salary string in column B, then enter these 4 formulas into columns C, D, E, F respectively. The patterns handle decimal values, which matters for hourly rates:
- Column C (min):
=VALUE(REGEXEXTRACT(B2, "\\$([0-9,]+(?:\\.[0-9]+)?)")) - Column D (max):
=VALUE(REGEXEXTRACT(B2, "\\$[0-9,]+(?:\\.[0-9]+)? - \\$([0-9,]+(?:\\.[0-9]+)?)")) - Column E (period):
=IF(REGEXMATCH(B2,"hour"),"HOUR","YEAR") - Column F (annualized midpoint):
=IF(E2="HOUR",(C2+D2)/2*2080,(C2+D2)/2)
When tested against 194 Indeed Senior Software Engineer (SWE) postings in San Francisco, this pattern parses 193 cleanly. The one that does not parse is a single-number posting ($86 an hour), which the formula returns as min only. You filter those rows out before computing percentiles, the same way that the Python parser does.
LinkedIn's salaryInsights is a nested JSON object that Sheets does not parse cleanly. The simpler route for a spreadsheet-only workflow is to use the All Jobs Actor (which flattens LinkedIn into the same parsed numeric schema) instead of the LinkedIn Actor directly.
Compute P25, P50, P75
The Python equivalent:
import statistics
mids = sorted(r["annual_mid"] for r in rows)
p25, p50, p75 = statistics.quantiles(mids, n=4)[0], statistics.median(mids), statistics.quantiles(mids, n=4)[2]
In Google Sheets, you can compute the percentiles on the whole annualized-midpoint column:
=PERCENTILE.INC(I:I, 0.25)
=PERCENTILE.INC(I:I, 0.50)
=PERCENTILE.INC(I:I, 0.75)
Here is what this looks like on the demo dataset once it's loaded into a Sheet:
The percentile formulas below operate on the annual_mid column (column I in this layout), both across the full dataset and within FILTER-wrapped cuts like the one introduced next.
For a specific cut (e.g. Senior Software Engineer in San Francisco only), wrap the range in FILTER() so the percentile is computed on the filtered rows:
=PERCENTILE.INC(FILTER(I:I, ISNUMBER(SEARCH("Senior Software Engineer", D:D)), ISNUMBER(SEARCH("San Francisco", E:E))), 0.5)
This is what yields the $210,000 P50 in the cross-source comparison.
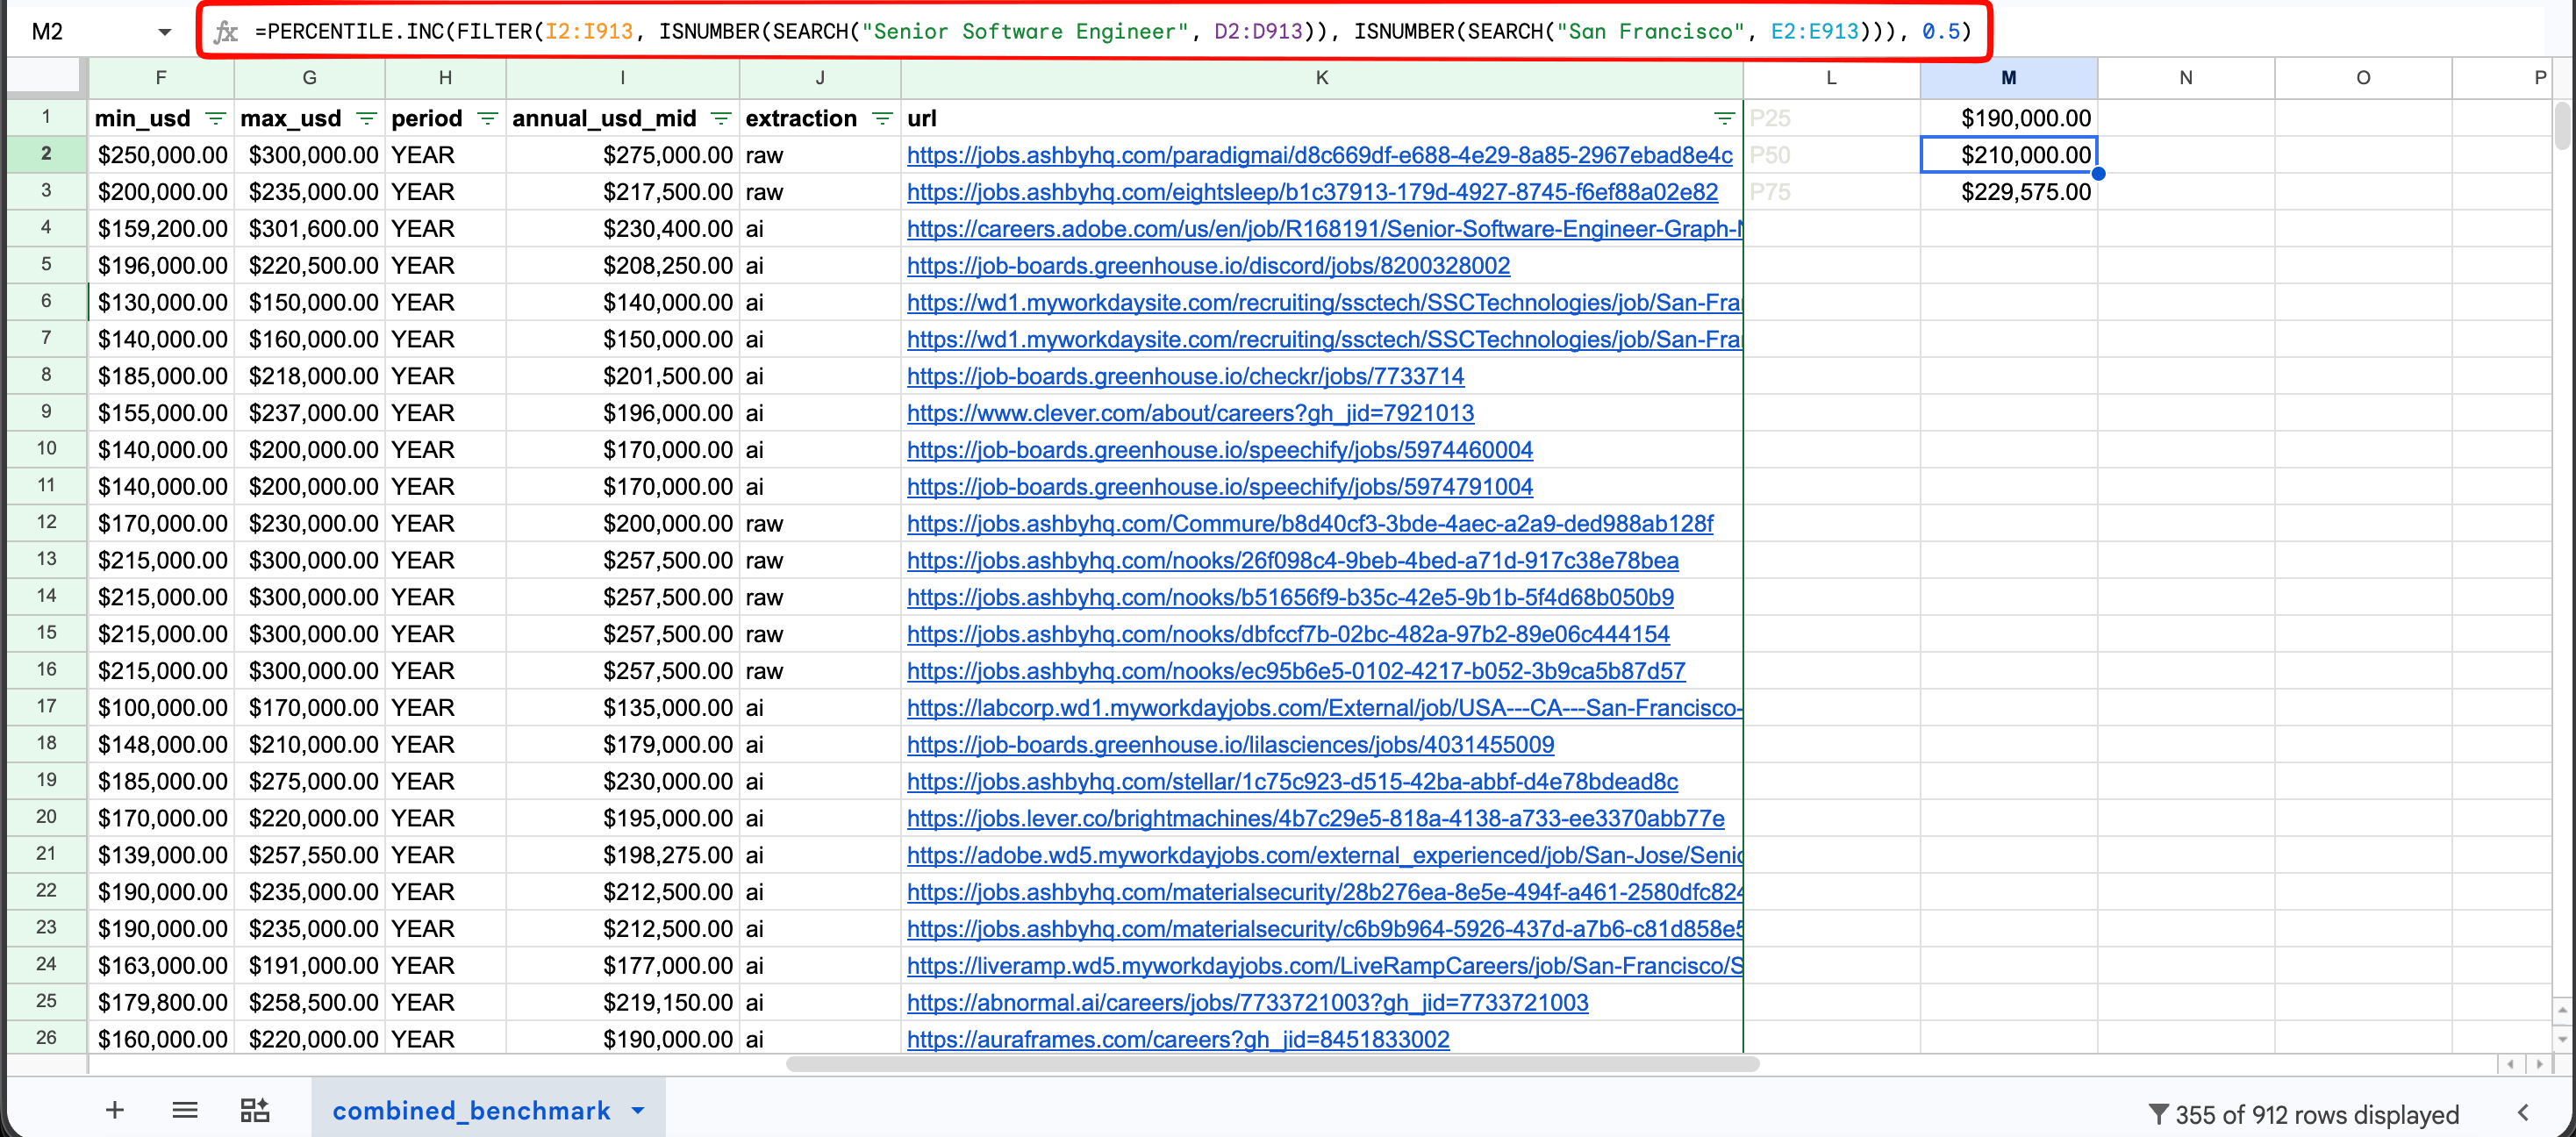
The FILTER-wrapped PERCENTILE.INC formula returning $210,000 for the Senior SWE in San Francisco P50, computed across the 355 filtered rows. P25 ($190,000) and P75 ($229,575) appear in the cells above and below using the same formula with 0.25 and 0.75 as the percentile argument. The bounded range I2:I913 in the screenshot matches the demo's 912-row dataset; the open-ended I:I shown in the formula above returns the same result and scales as you add rows.
In practice, our thresholds are looser than the textbook N ≥ 30 because comp work routinely has small cuts. A practical rule that we use for collected data is N ≥ 10 for P50 (with a sample-size footnote on the deliverable), N ≥ 15-20 for P25 and P75, and full deciles only when N is meaningfully larger. If you drop below those, broaden the title (Senior Software Engineer or Senior Backend Engineer or Senior Full Stack Engineer), broaden the metro (SF Bay Area instead of San Francisco proper), or use a survey checkpoint as a fallback for that cut.
Translate the benchmark into a posted range
A market percentile is not a posted range. For pay-transparency-law compliance, you have to put a specific number-to-number band on the job posting itself.
The standard practice in mature comp programs is midpoint progression: take the market P50 as the range midpoint, and set a spread around it that matches the role's career stage. Tech IC (individual contributor) bands typically run tighter than the legacy 30-50% general-industry convention. Spreads narrow for ICs and widen as you move toward Staff, Principal, and management roles.
If Senior SWE P50 is $210,000 (the combined number from the cross-source comparison), a 25% spread is a reasonable starting point and gives roughly $185,000 to $235,000. The right spread for your own structure should be checked against existing pay bands or with a comp consultant before launching.
Early-stage startups without formal pay structures sometimes skip the structure step and post the market P25 to P75 directly. That works as a quick substitute but does not scale to a full comp program. Whichever convention you pick, document it in the same Sheet next to the dataset so the next analyst knows the reasoning behind the band.
Adjust for geography
If you are benchmarking remote-eligible roles across multiple metros, derive a multiplier table from actual data instead of guessing. A reliable approach is to use the Bureau of Labor Statistics (BLS) Occupational Employment and Wage Statistics, which publishes mean annual wages by metropolitan area for Standard Occupational Classification (SOC) code 15-1252 (Software Developers).
Pull the SF-area mean and each target metro's mean, divide one by the other, and apply the resulting ratio to your SF benchmark. As a rough starting point before that work is done, common rule-of-thumb multipliers for tech roles cluster around 0.95-1.00 for NYC/Seattle, 0.85-0.92 for Austin/Boston/Denver, and 0.70-0.80 for lower-cost metros. Treat those as a placeholder until you derive your own from BLS or from your own cross-metro Actor pulls.
Cross-check across sources
The trust signal is consistency across sources with different biases. Exact agreement between sources is not required. Each source has known biases: Levels.fyi skews toward larger tech companies and self-selected reporters with higher pay; Glassdoor's salary submissions are self-reported and skewed by who chooses to submit; Indeed's senior and confidential roles have sparser coverage than its junior roles.
When two or three sources agree within the same range and the divergence has a structural explanation (e.g. LinkedIn skews lower because of startup mix), you can defend the central tendency. In our experience, a single-digit percentage spread across sources tends to be within normal noise; a double-digit spread is a signal to investigate before publishing.
Your comp committee will care about one distinction: posted ranges and surveyed paid compensation are different things. A posted range is what an employer will pay anyone in that band; surveyed paid comp is what incumbents receive. The two can differ in either direction depending on the company mix in each sample.
In our run, the career-site posted P50 was $208k (across a broad mix that included smaller startups) while Levels.fyi paid base P50 was $230k (limited to top-tier tech companies that pay higher base). Use scraped posted-range data for live offer construction and negotiation reference. Use Levels.fyi-style paid-comp data and survey data for pay structure design and pay equity audits. Disclose the sample composition in your methodology footnote so the committee knows which mix produced each number.
Here are the numbers from the demo run. The per-source N counts are the raw normalized record counts that each Actor produced. The combined row is the same dataset after a title + location filter (title contains "Senior Software Engineer", location contains "San Francisco"), which is why it is smaller than the sum of the row totals.
| Source | N (raw) | P25 | P50 | P75 |
|---|---|---|---|---|
| career-site direct | 273 | $190,000 | $208,000 | $226,650 |
| all-jobs (Indeed + LinkedIn + Glassdoor) | 414 | $188,097 | $219,921 | $274,719 |
| Indeed | 193 | $192,250 | $217,150 | $241,375 |
| 32 | $166,250 | $197,250 | $214,375 | |
| All sources combined, after filter | 355 | $190,000 | $210,000 | $229,575 |
For Levels.fyi (Senior+ tech, ~140-150 records in SF Bay), base P50 is roughly $230,000 and total comp P50 is roughly $555,000.
The base percentiles across sources are in the same range. LinkedIn at N=32 has a wider standard error than the other sources and skews lower (possibly because LinkedIn includes more earlier-stage startup roles). Drop LinkedIn from the cross-source comparison or note its small N in a footnote, and the remaining three sources agree within a tighter spread.
The total comp gap from Levels.fyi shows what posted ranges miss: they exclude stock and bonus. A Senior SWE base in SF Bay is around $210-230k. The actual offer that the candidate compares yours to is higher once stock and bonus are factored in. For top-tier tech companies (the Levels.fyi sample that we pulled), total comp medians are around $555k. Broader samples across the full Senior SWE market would show lower totals, so disclose the company mix in your methodology footnote.
Automate the refresh so the benchmark stays current
A one-time scrape gives you a snapshot, but a scheduled refresh keeps the picture current.
Save as an Apify task
An Apify task is a saved, named configuration of an Actor that you can run repeatedly without retyping the input. A comp analyst who tracks 20 roles can create 20 different tasks, and each task has its own title, geography, and filters. They can then re-run any of them with a click or trigger them on a schedule. It is also the cleanest way to pass the pipeline to a teammate when comp ownership changes. They inherit the tasks instead of inheriting your hand-written notes about the input configuration.
Here is what a saved task looks like in Apify Console:
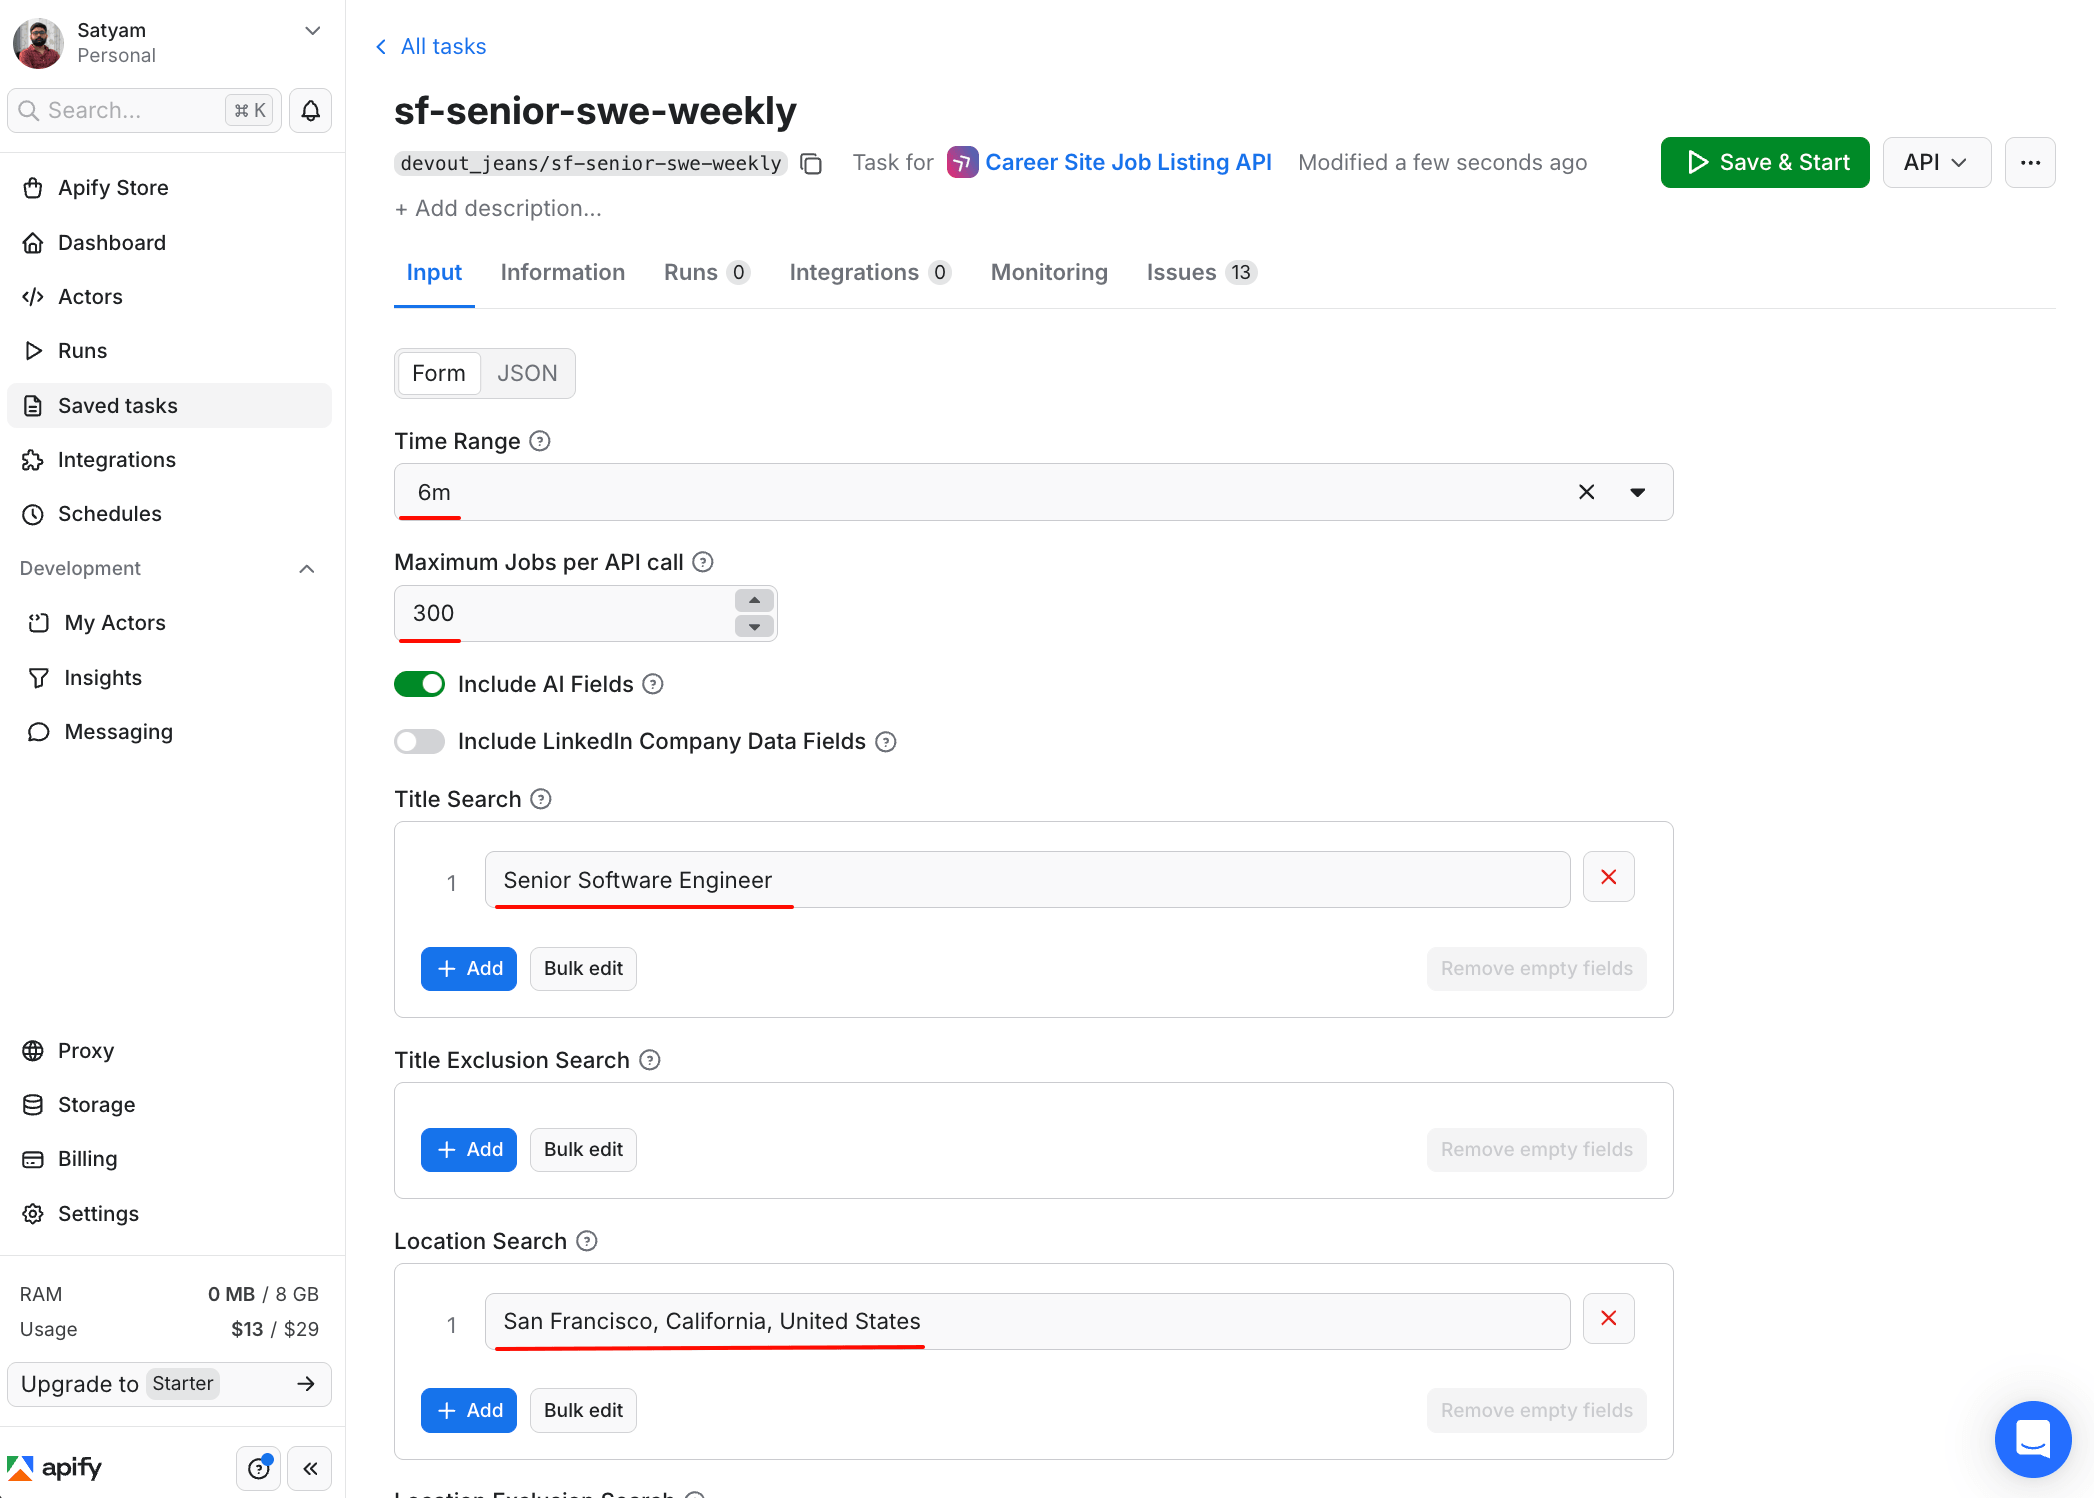
The same input snippet from the build section earlier is now saved as the task sf-senior-swe-weekly, running on the fantastic-jobs/career-site-job-listing-api Actor. Clicking Save & Start re-runs the same configuration without retyping. The Integrations and Monitoring tabs let you point a webhook or set up alerts on this task without modifying the Actor's input form.
Schedule the refresh
The Apify scheduler is cron-style. Set a weekly trigger on each task, and the dataset refreshes every Monday morning.
Here is what a live schedule looks like when it runs that task:
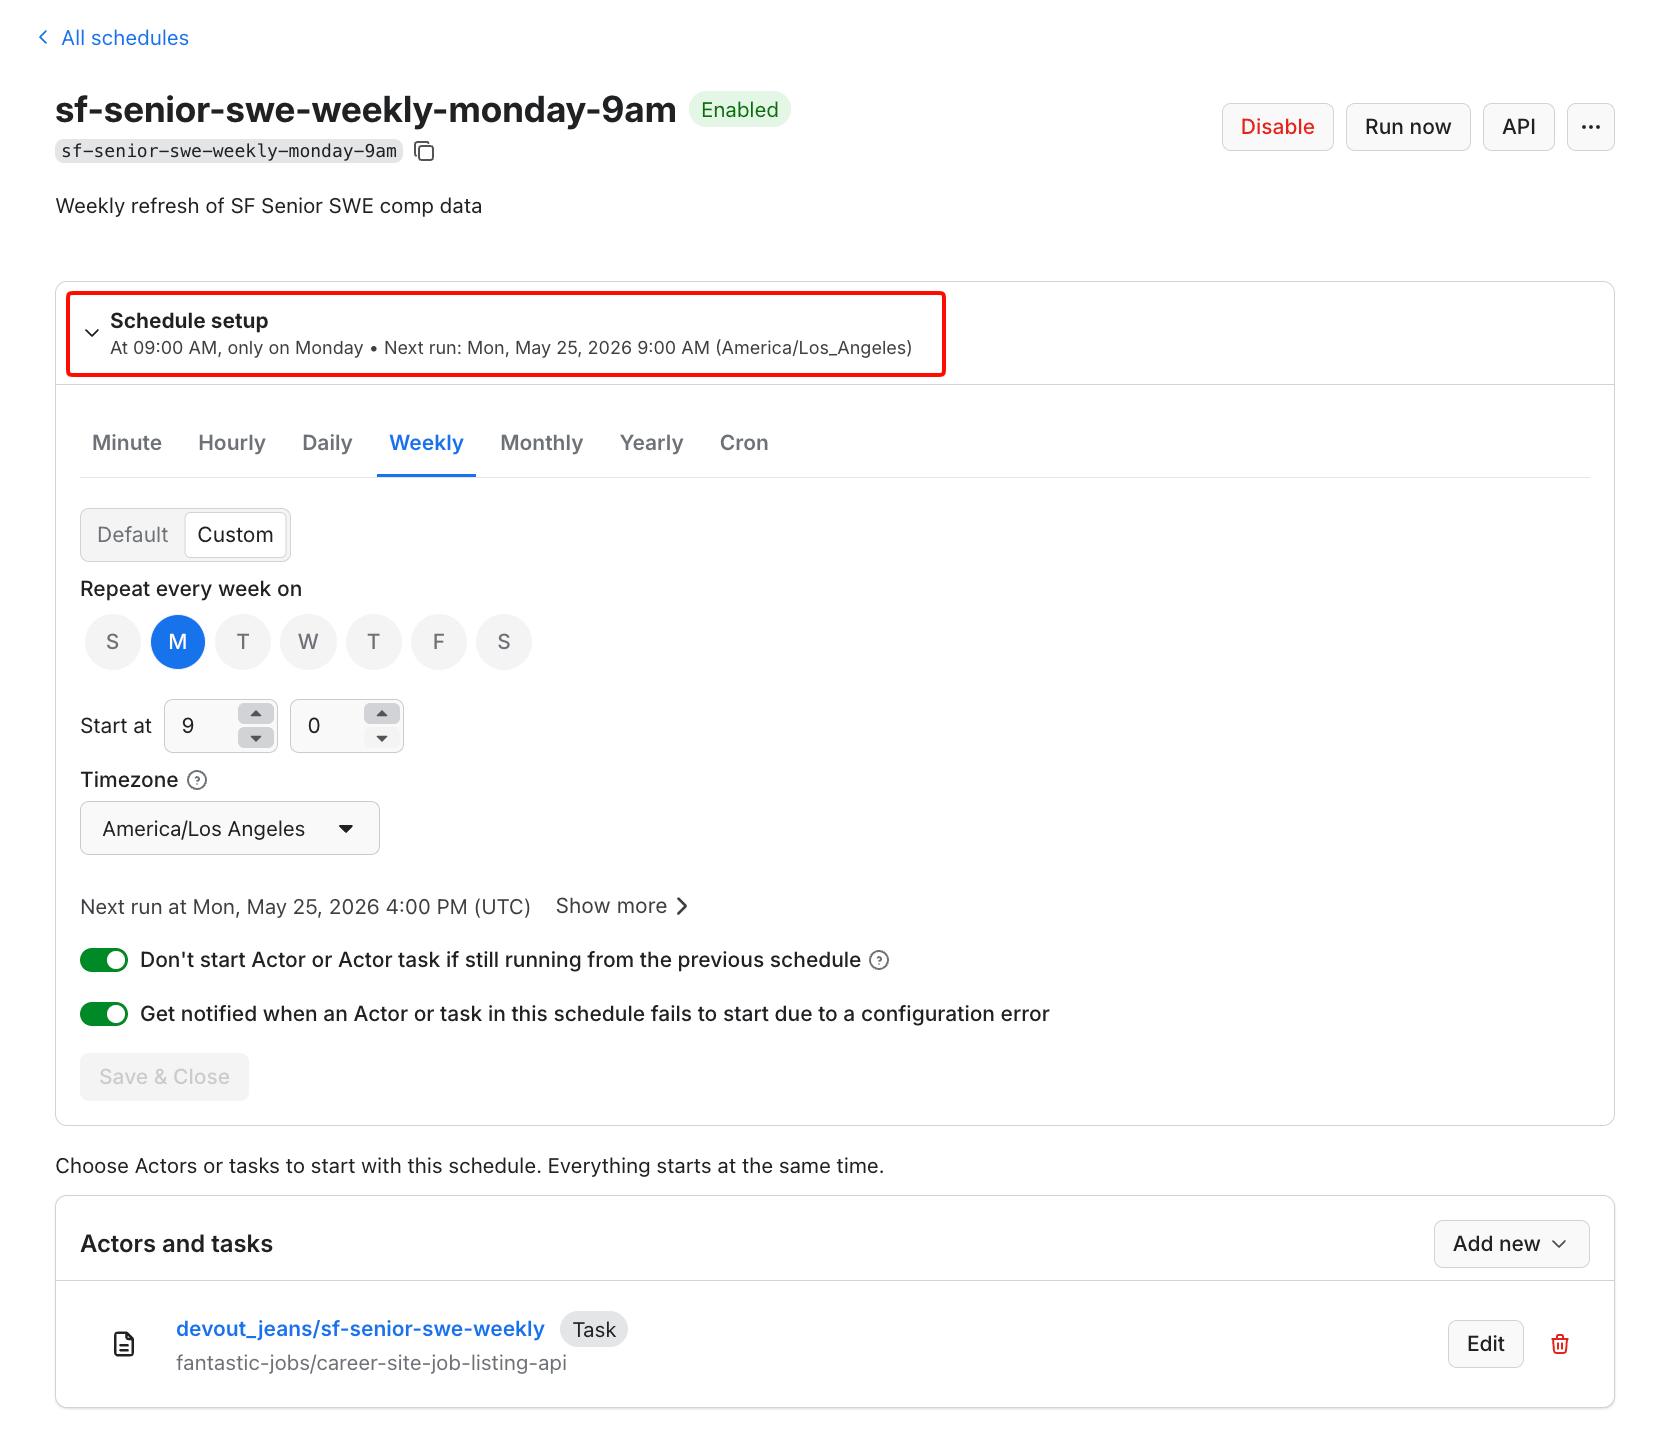
The task linked at the bottom is the same sf-senior-swe-weekly saved in the previous step, which means the schedule fires the input configuration shown in the build section earlier. Every Monday morning, the dataset refreshes automatically without further setup.
Send results to your existing tools
Native integrations include Airtable, Slack, Make, Zapier, and n8n. Google Sheets is one extra stop through Make or Zapier (not a direct integration). The pattern that most comp analysts use:
- Career-site Actor → CSV export → Make → Google Sheet (one tab per refresh date)
- Webhook on run success → Slack message → "new comp data is in"
- Levels.fyi Actor → Airtable → linked record to internal role catalog
Run it from Claude or ChatGPT (Apify MCP)
For teams that are already using Claude or ChatGPT, any Actor in this pipeline can run from a chat window. The Apify MCP server exposes Apify Actors as callable tools to AI assistants that support the Model Context Protocol (MCP), including Claude Desktop, Cursor, and VS Code via GitHub Copilot. Once you have configured the MCP connection in your assistant, you can ask:
"Pull median base salary for Senior Software Engineer roles posted in San Francisco in the last 30 days. Use the career-site Actor. Return P25, P50, P75 and the source URLs."
The model selects the right Actor, fills in the input, runs it, parses the dataset, and returns the answer in chat. There is no pipeline to set up.
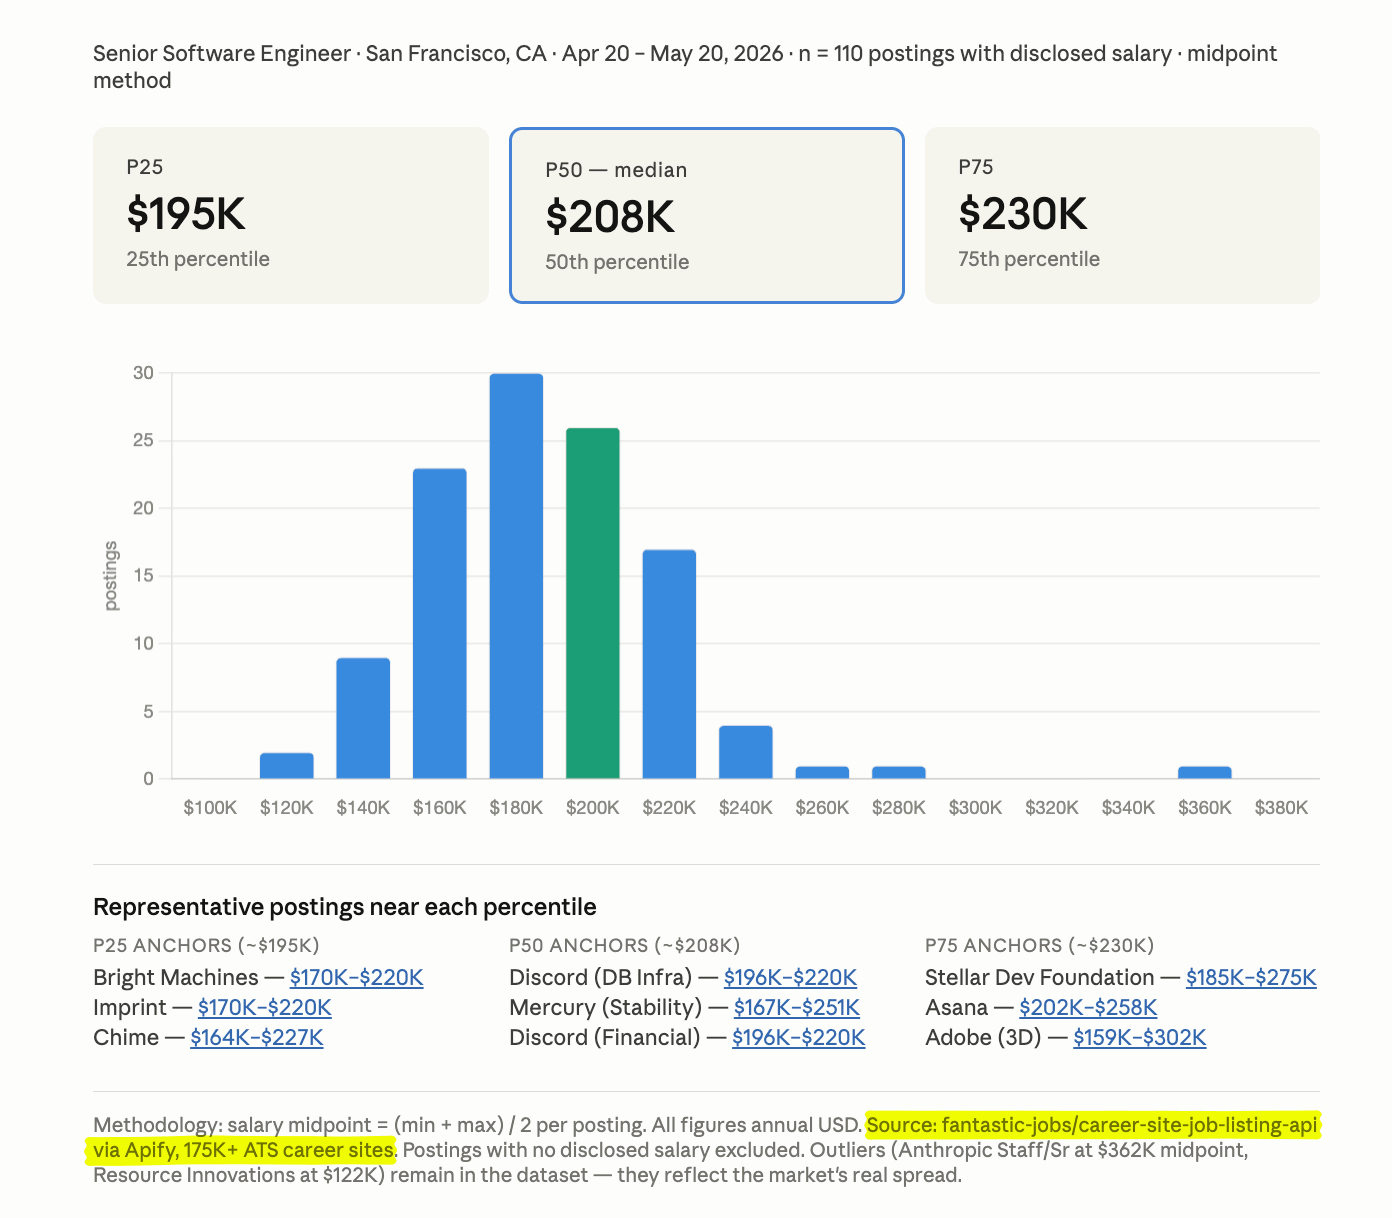
Behind the scenes, Claude invoked the fantastic-jobs/career-site-job-listing-api Actor, pulled 110 SF Senior SWE postings from the last 30 days, computed midpoints, and rendered the dashboard in one chat turn. The percentiles differ slightly from the cross-source table earlier in this post because this was a fresh pull on a different day with a 30-day window, which is why scheduled refreshes exist.
This is an alternative for teams who already use Claude or ChatGPT in their daily workflow. It is not the main route for most teams, because MCP setup takes a few minutes the first time. The minimum setup for Claude Desktop is a 4-line addition to your claude_desktop_config.json that references the Apify MCP server URL and your API token. The full step-by-step guide is in the Apify MCP docs. For teams who use these tools daily, it is the fastest way to ask one-off comp questions without building a pipeline.
How much does it cost?
Most of the Actors used in this guide run on pay-per-result pricing. The cost scales with how many rows you pull, and there is no fixed seat or subscription cost. Apify per-Actor pricing also varies by your subscription plan: on Free you pay the retail rate, Starter adds a Bronze discount (2-17% depending on the Actor), Scale ($199/month) adds a larger Silver Store discount, and Business ($999/month) adds the largest Gold discount.
The following table lists Free plan pricing, which is the worst case for most readers. The numbers assume one weekly run of about 1,000 records per source.
| Source | Actor | $ per 1,000 (Free) | Weekly cost at 1,000 records |
|---|---|---|---|
| Career site (175k+ career sites) | fantastic-jobs/career-site-job-listing-api | $12.00 | $12.00 |
| Multi-source (Indeed + LinkedIn + Glassdoor) | agentx/all-jobs-scraper | $2.80 | $2.80 |
| Indeed | misceres/indeed-scraper | $6.00 | $6.00 |
| curious_coder/linkedin-jobs-scraper | $1.00 | $1.00 | |
| Levels.fyi | shhh_lab/levels-fyi-salary-scraper | $4.50 | $4.50 |
| Glassdoor (1 record per query) | memo23/glassdoor-scraper-ppr | $4.75 | ~$0.10 at 20 queries weekly |
| PayScale (conditional) | parseforge/payscale-scraper | $8.00 | $8.00 |
A typical 5-Actor weekly refresh across the primary stack (career-site, all-jobs, Indeed, LinkedIn, Levels.fyi) on the Free plan costs roughly $114 a month. Glassdoor adds very little to the total because each query returns one aggregated record, so 20-50 role-and-metro queries a week cost less than $1 a month.
The same stack on Scale drops to roughly $73 a month; on Business it drops to roughly $58. Apify's Starter plan is $29 a month and includes $29 in usage credits, which fully covers a smaller pipeline (career-site at lower limits, plus LinkedIn and all-jobs).
For comparison, a Mercer or Radford subscription is typically priced in the five-figure range per year. Pave does not publish enterprise pricing. Even at the Free-plan $114-a-month cost for all 5 Actors, the cost difference is roughly two orders of magnitude.
Next steps
Pick one role and one geography that you need to benchmark this week. Start with the career-site Actor. It has the simplest data structure and produces a usable benchmark within some hours for less than $5.
For anything that you plan to keep running, set these defaults on day one:
- Save the Actor configuration as an Apify task so you re-run it with one click instead of re-typing the input.
- Send the dataset to a Google Sheet or Airtable on every run, so the data persists past Apify's dataset retention window.
- Set up Apify monitoring alerts on each task to catch run failures or sudden drops in field counts (a common signal that the source site changed and broke the Actor). Channels include email and Slack.
- Document your methodology (sources, dates, sample sizes, and normalization rules) in the same Sheet, in a tab next to the data. Comp committees require a methodology footnote to defend the figure.
When you hit coverage limits, add a second source: Levels.fyi for tech total comp, PayScale for non-US non-tech, Glassdoor for pre-computed percentiles.
If your data collection work extends beyond comp data, Apify's job scraping tools roundup catalogs the rest of the stack. Teams that prefer a managed pipeline can use Apify's professional services team - an updated Sheet in your inbox each week, no engineering work.
Either way, the outcome is the same. Build the pipeline once, and refresh it weekly. You will have current compensation data ready for the next role that you need to benchmark.

FAQs
What is salary benchmarking vs. market pricing?
Salary benchmarking compares your pay to annual survey data. Market pricing compares it to live job-posting data and offers, which are refreshed continuously. Surveys give a peer-group baseline; market pricing shows what the role is currently paying. Modern comp programs use both.
How often should you benchmark compensation?
Benchmark whenever you have a comp decision to make. The traditional cycle is annual and aligned with the comp review window, but job-posting and platform data refresh weekly or daily. For rapidly evolving roles, you can pull current data in minutes. You do not need to wait for next year's Mercer release.
Is it legal to scrape salary data?
Yes. Scraping publicly posted job listings is legal, and pay-transparency laws in more than a dozen US states require posted ranges. Prefer aggregators over ATS sites with restrictive terms. Apify is SOC 2 Type II audited; the Apify Trust Center is what procurement reviews.
Where can I find free salary data?
Glassdoor, Levels.fyi, PayScale, and career-site postings in pay-transparency states (CA, NY, CO, WA, IL) are publicly accessible. Collecting them at scale costs money. Apify Actors run on pay-per-result pricing, typically $1 to $12 per 1,000 records on Free, and the cost is less on higher plans.