The biggest risk to product demand analysis is lag time. Before a market shift becomes an official trend, your competitors have already captured the demand by acting on early signals.
Those initial demand signals almost always show up in customer reviews first. Buyers tell you exactly what they want or what is missing long before market reports catch up. The problem is that manually reading through thousands of reviews just creates another massive delay.
In this tutorial, you’ll build an automated pipeline that turns raw reviews into structured, timestamped demand signals, so you see what the market wants as it forms, not months later in a trend report.
You'll use Apify to extract reviews at scale, OpenAI to read each one and label the demand signal, Airtable to store the results as an interactive dataset, and n8n to orchestrate the entire workflow.
Prerequisites
- Apify account.
- OpenAI account with billing enabled.
- Airtable account.
- Self-hosted n8n instance via Docker (skip this if you prefer the n8n cloud tier).
What you'll build and why?
For this tutorial, you’re targeting competitors in the project management software space, such as Asana, Notion, Jira, and Trello, to identify user pain points and how these complaints translate into product demand signals for a much-needed feature or a completely new product.
To get you started quickly, the scope is limited to G2 reviews. However, you can easily attach multiple Actors and draw from an extensive list of web data sources for any platform via Apify Store.
Phase 1: Accounts and credentials
The steps below will guide you through setting up the accounts you need for this project. Make sure to save every credential securely before proceeding.
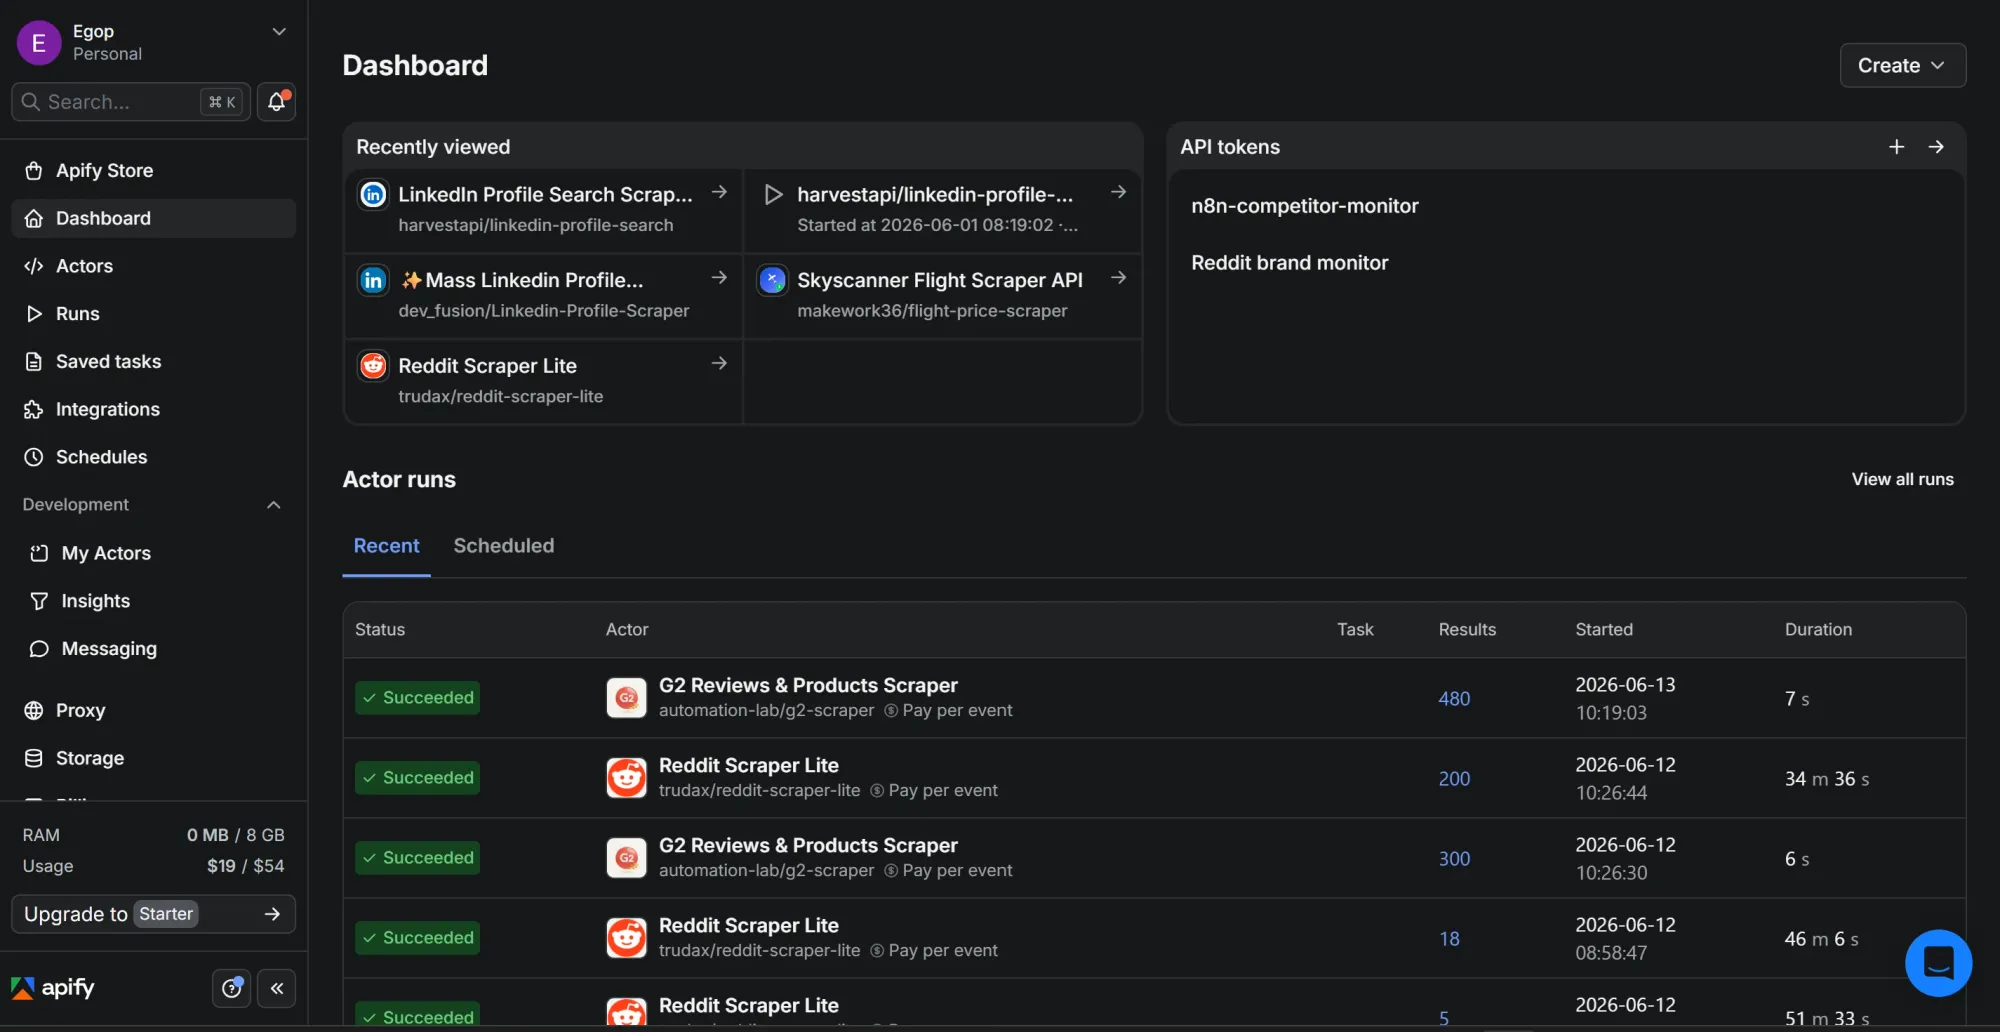
Step #1: Grab your Apify API token
- Sign up at apify.com if you don't already have an account.
- Open Apify Console.
- On the left sidebar, click Settings, then open the API & Integrations tab.
- Under "Personal API tokens," copy your default token, or click Add new token, give it a name, then copy it.
- Save it somewhere temporary.
This token lets n8n run an Actor on your behalf and retrieve the scraped dataset. Without it, the Apify node can’t authenticate your requests.

Step #2: Get your OpenAI API key
- Go to platform.openai.com and sign in or create an account.
- Open Billing and add a payment method with some starting credit. The model used here is cheap, but the key won’t work against a zero balance.
- In the left sidebar, open API keys, then click Create new secret key.
- Give it a name and click Create secret key.
- Copy the key immediately. OpenAI shows it only once, then it’s gone.
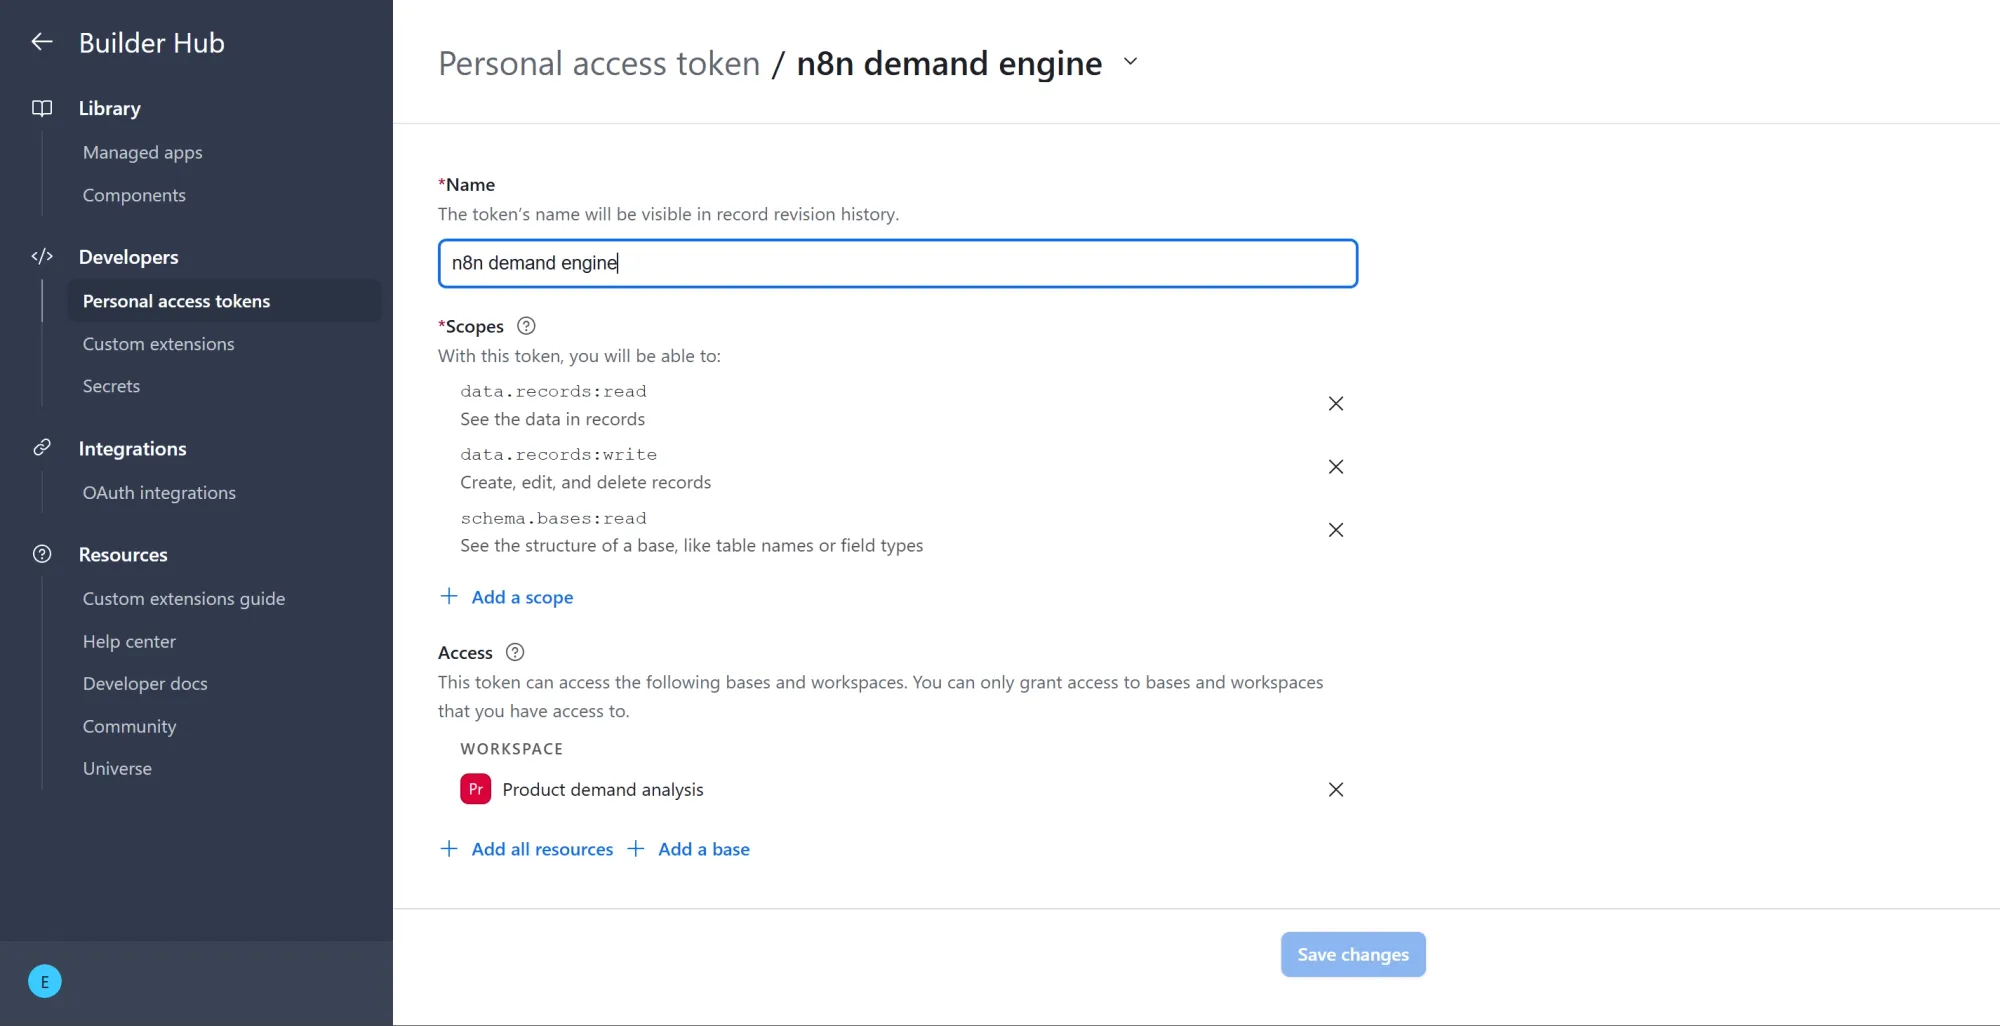
Step #3: Create your Airtable personal access token
Airtable retired the old API keys, so the current way to authenticate an external tool like n8n is a personal access token (PAT).
- Sign in at airtable.com, then go to airtable.com/create/tokens/new
- Give the token a descriptive name like
n8n demand analysis. - Click Add a scope and add these three:
data.records:read,data.records:write, andschema.bases:read. - Under "Access," click Add a base and select only the base this workflow will write to. Avoid granting access to every base, since a narrow token is safer if it ever leaks.
- Click Create token and copy it at once. Like the OpenAI key, the full value is shown only once.
Together, the three scopes give n8n just enough access to do its job. data.records:write lets it create and update rows in your Signals table, data.records:read lets it check whether a review is already saved, so it updates that row instead of creating a duplicate, and schema.bases:read lets it see your tables and field names so you can pick the right base and table and map each value to the correct column.
Step #4: Build the Airtable base and Signals table
The workflow writes its results into an Airtable table, so build that table now and match the field names exactly. n8n maps to columns by name, and a mismatch is the most common reason a row fails to save.
- Go to airtable.com and create a new base. Name it.
- Rename the default table to
Signals. - Set up these 12 fields, with the exact names and types below.
| Field name | Field type | Options to add |
|---|---|---|
Name |
Single line text | This is the primary field |
signal_id |
Single line text | |
source |
Single select | G2 |
product |
Single line text | |
source_url |
URL | |
review_month |
Single line text | |
signal_type |
Single select | missing_feature, pricing_friction, quality_issue, integration_gap, usability_friction, other |
pain_point |
Long text | |
has_workaround |
Checkbox | |
intensity |
Single select | low, medium, high |
intensity_score |
Number | Precision: 1 (whole number) |
demand_cluster |
Single line text |
For the three single-select fields (source, signal_type, and intensity), type the options exactly as written above, lowercase included. n8n checks a value against the field's existing options before it ever reaches Airtable, so if the model returns medium and your option is Medium, it ignores the row.
Here is what each column above does:
Name: a label for the row, so you can scan the table and see at a glance which product its content belongs to.signal_id: the review's unique ID from the source site. It’s the column the workflow matches on, so the same review doesn’t save twice.source: which site the review came from. In this build, that’s always G2, but the field is built to handle others.product: which software the review is about, such as Asana or Notion.source_url: the direct link to the original review, so you can open and verify any row.review_month: the year and month the review was posted, handy for charting demand over time.signal_type: the category of the signal: is it a missing feature or a pricing complaint?pain_point: the actual unmet need, written in one sentence.has_workaround: whether the reviewer already found a hack to cope. A ticked box here means the pain is real but currently tolerated.intensity: how strongly the reviewer feels about this pain point, rated low, medium, or high.intensity_score: the same intensity expressed as a number (1, 2, or 3), so you can sort and average it.demand_cluster: a short theme label that groups similar pain points together.
Phase 2: Install and set up n8n
Self-hosting n8n allows you to build and run an unlimited number of workflows for free, with total control over your data privacy. But, if you don’t want to manage your own infrastructure, the n8n cloud tier works fine.
Step #1: Install Docker Desktop
- Download and install Docker Desktop for your operating system (OS).
- Confirm it's running by opening your terminal and running:
docker --version
- You should see a version number. If you see "command not found," Docker isn't in your PATH yet, so restart your terminal or reboot.
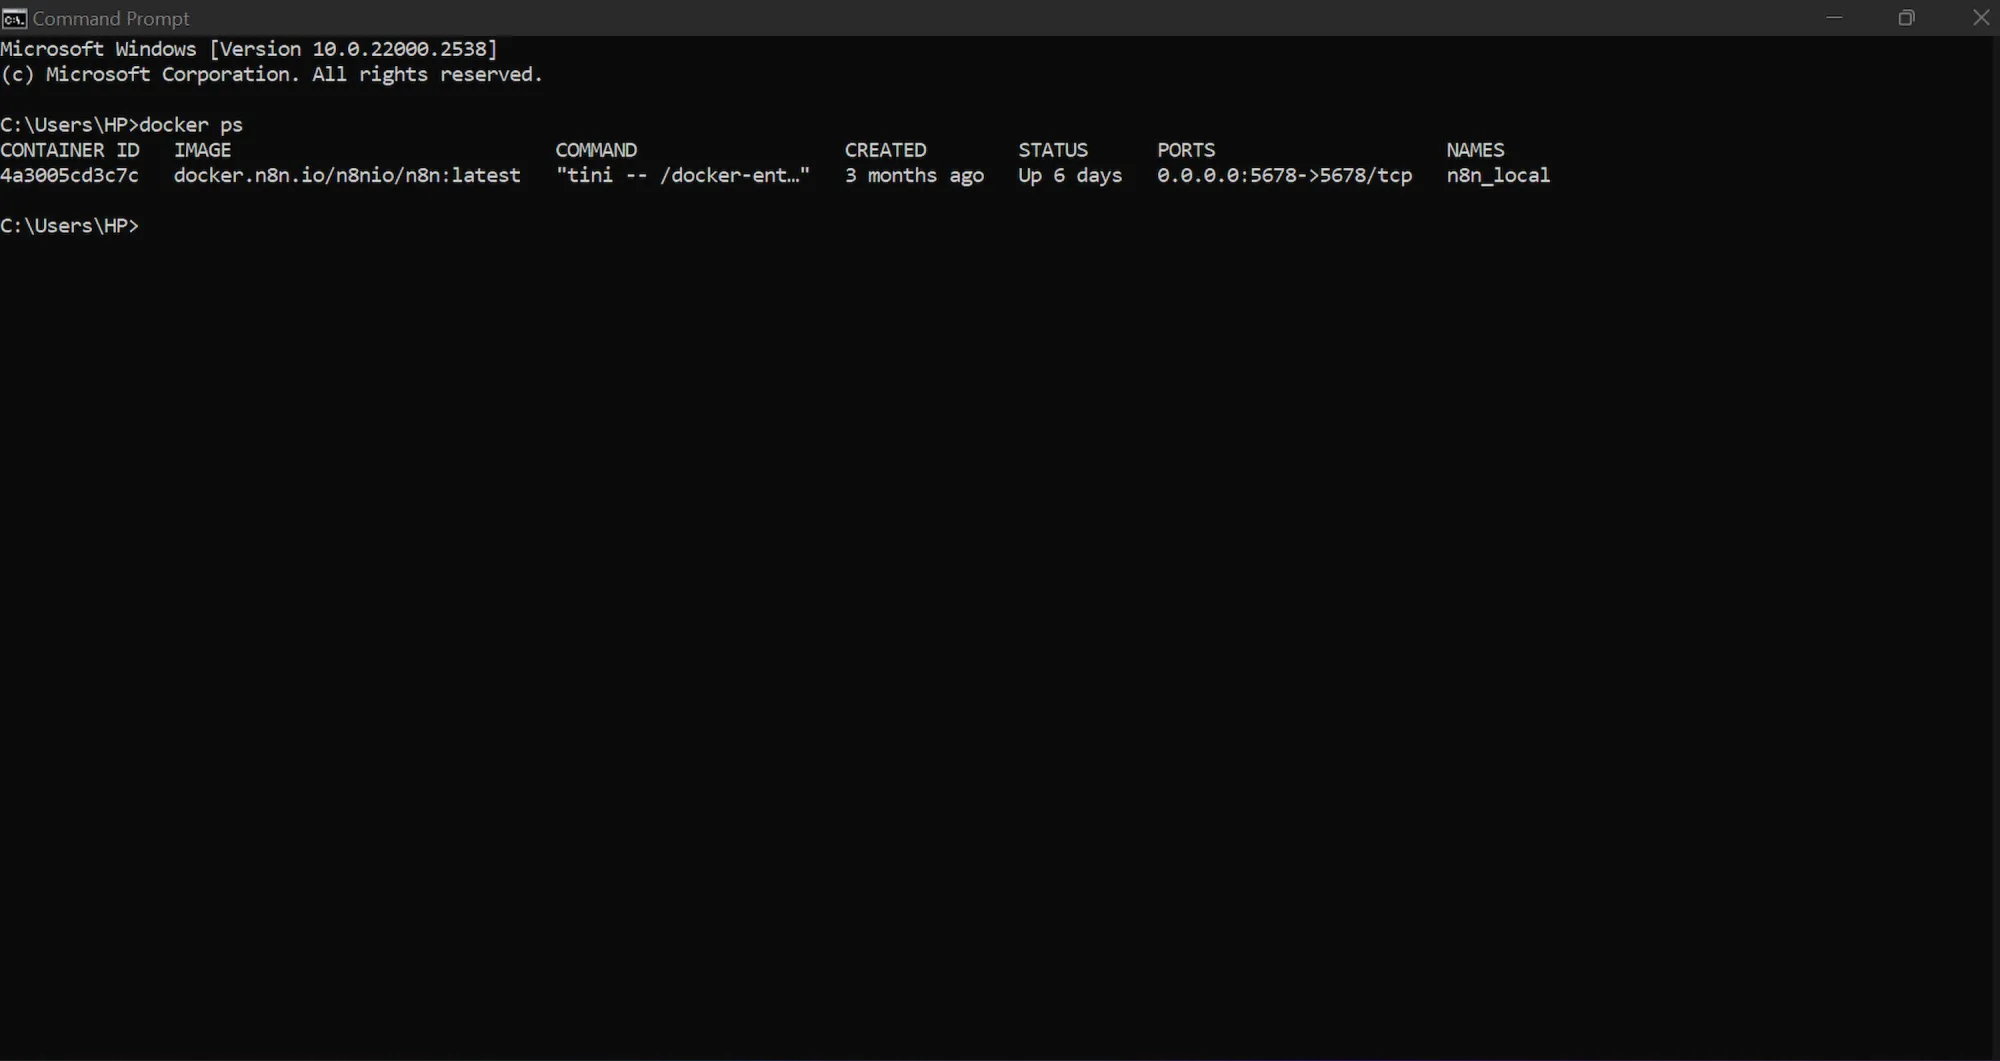
- Afterward, confirm the engine is running by typing
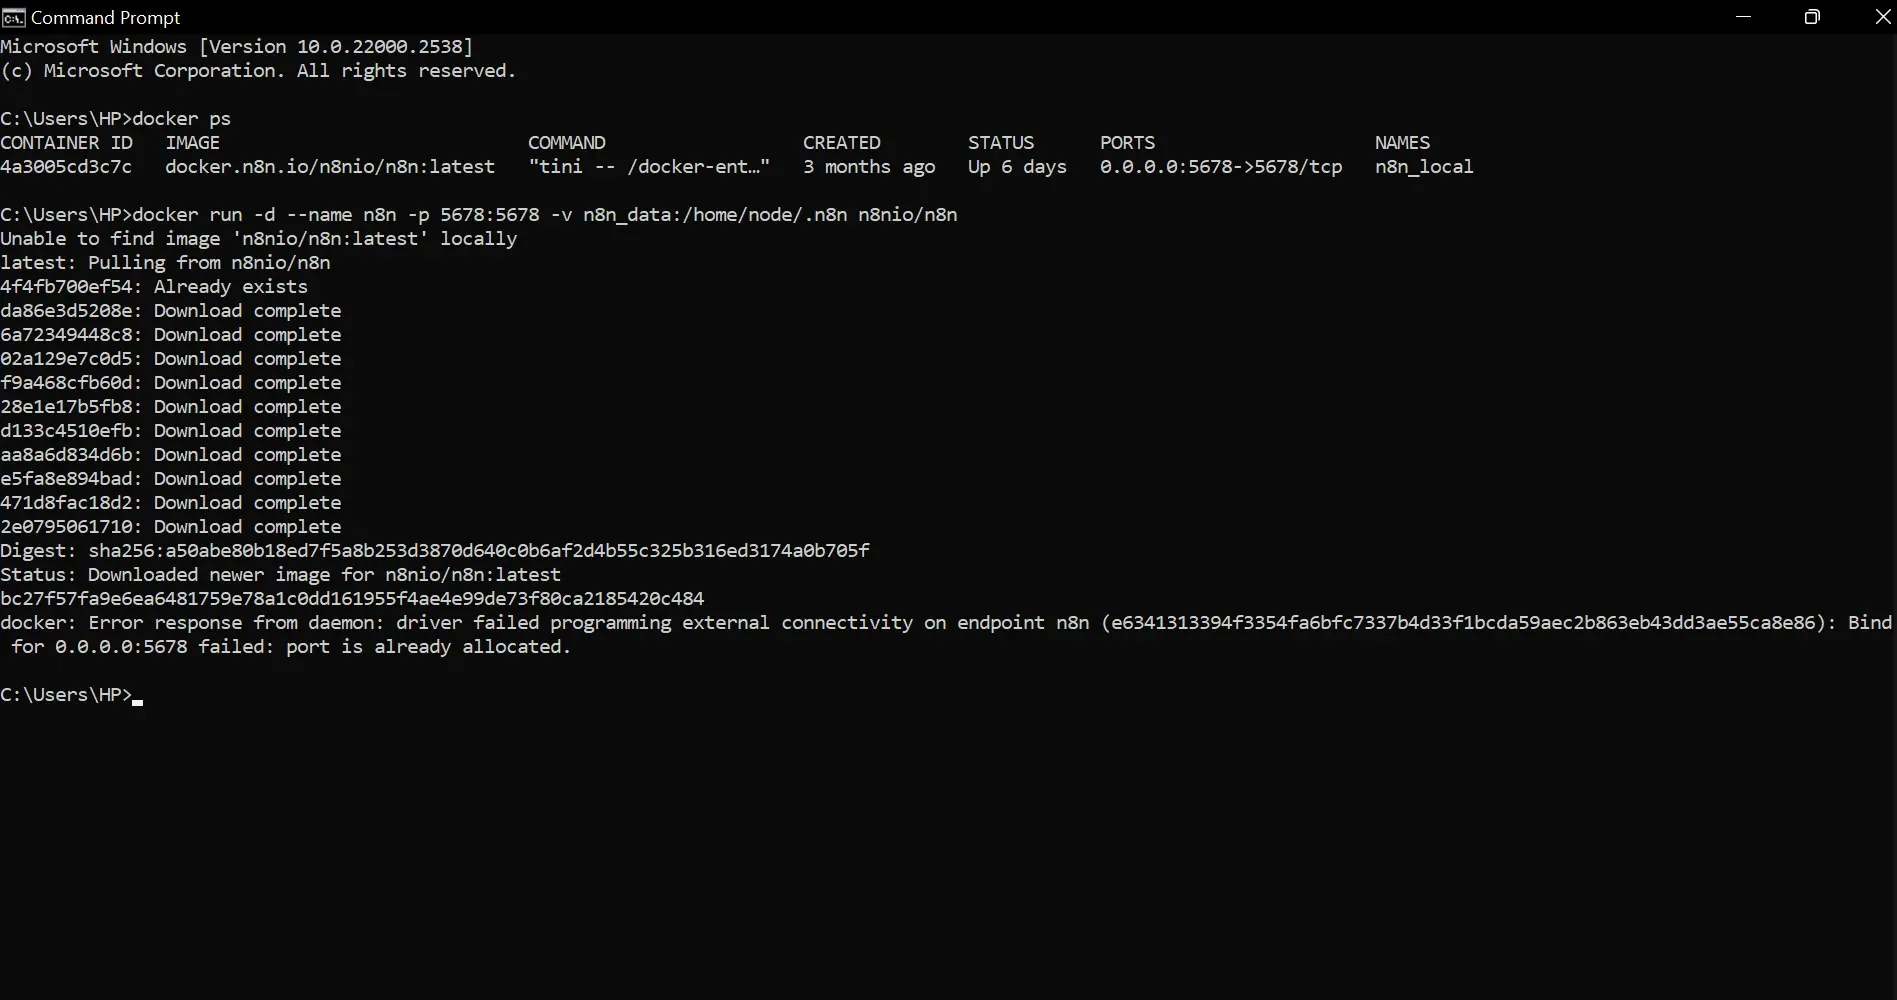
docker ps
Step #2: Run n8n in Docker
- Open your terminal.
- Run the command below to pull and start n8n:
docker run -d --name n8n -p 5678:5678 -v n8n_data:/home/node/.n8n n8nio/n8n
- The first time you run this command, Docker will pause to pull the official n8n image from the internet. After downloading, it will assign and print your Container ID.
- Open a browser and go to
http://localhost:5678. - You'll see n8n's initial setup screen. Create an owner account with your email and a password
Step #3: Install the Apify community node
n8n doesn't natively support the Apify node. You’ll need to install it as an official community node before you can use it. Here’s how to do that:
- In your n8n workspace, at the bottom of the left sidebar, click Settings, then navigate to Community Nodes and click Install.
- In the npm package field, paste exactly this:
@apify/n8n-nodes-apify - Check the risk acknowledgment box and click Install
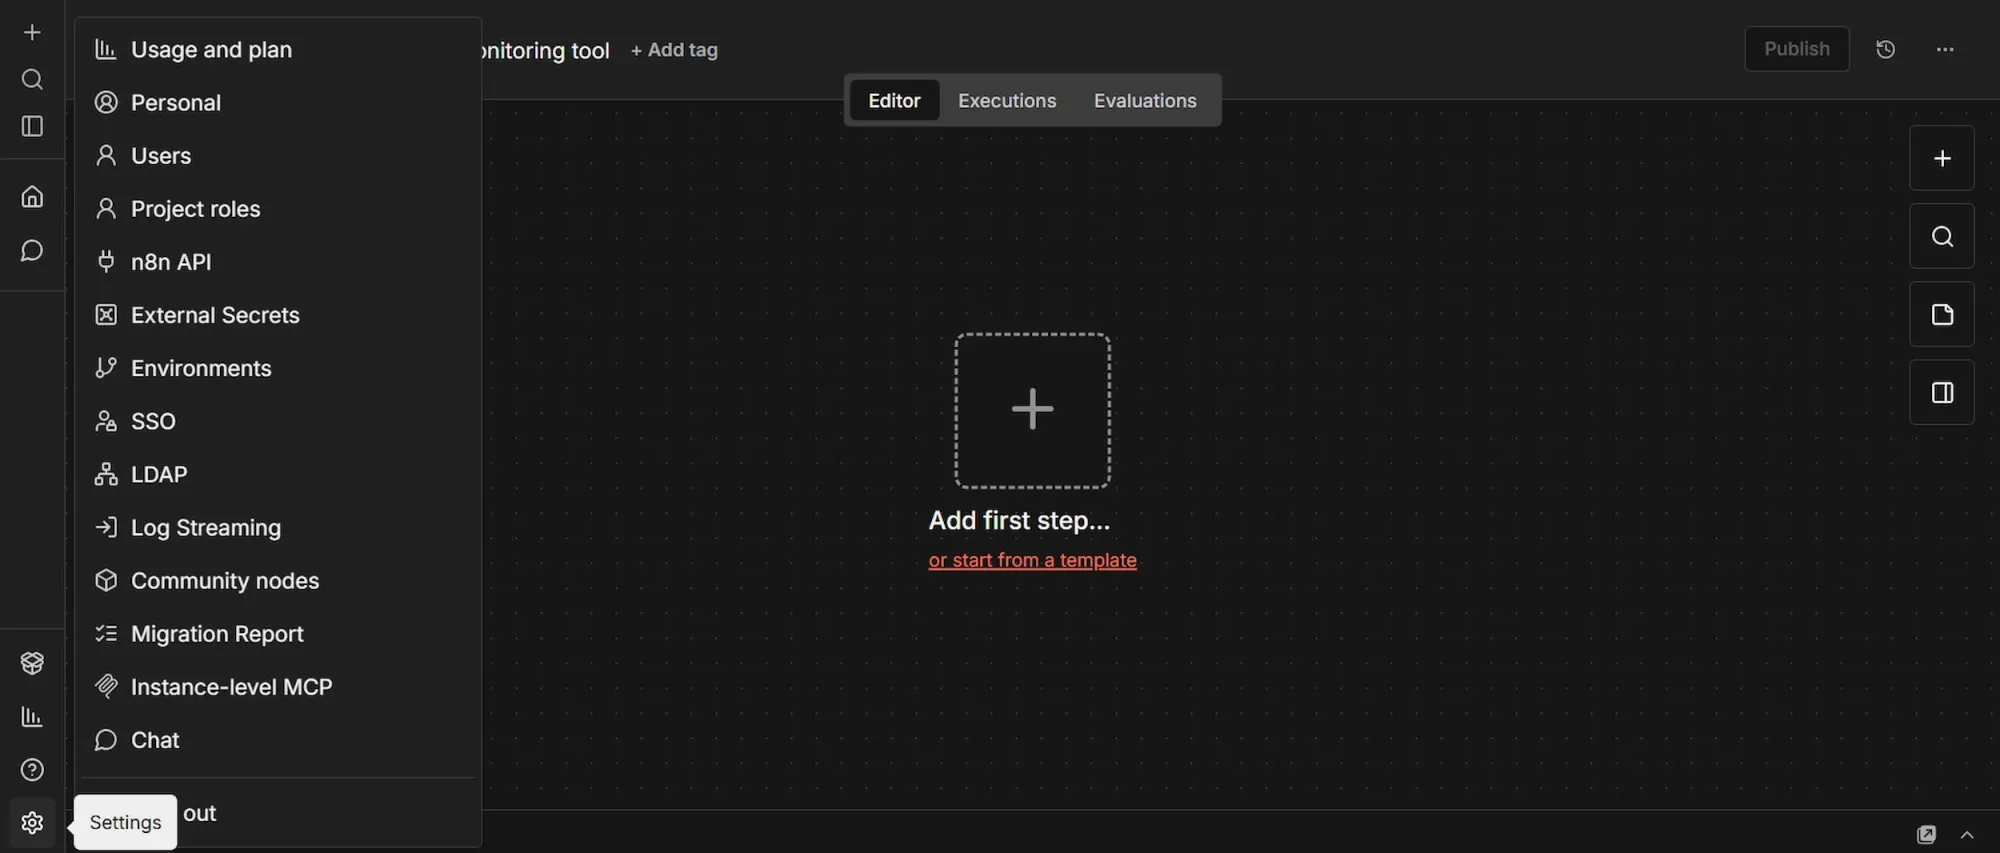
The other nodes in this pipeline (Information Extractor, OpenAI Chat Model, Filter, and Airtable) are built into n8n, so you only need to add this Apify node manually.
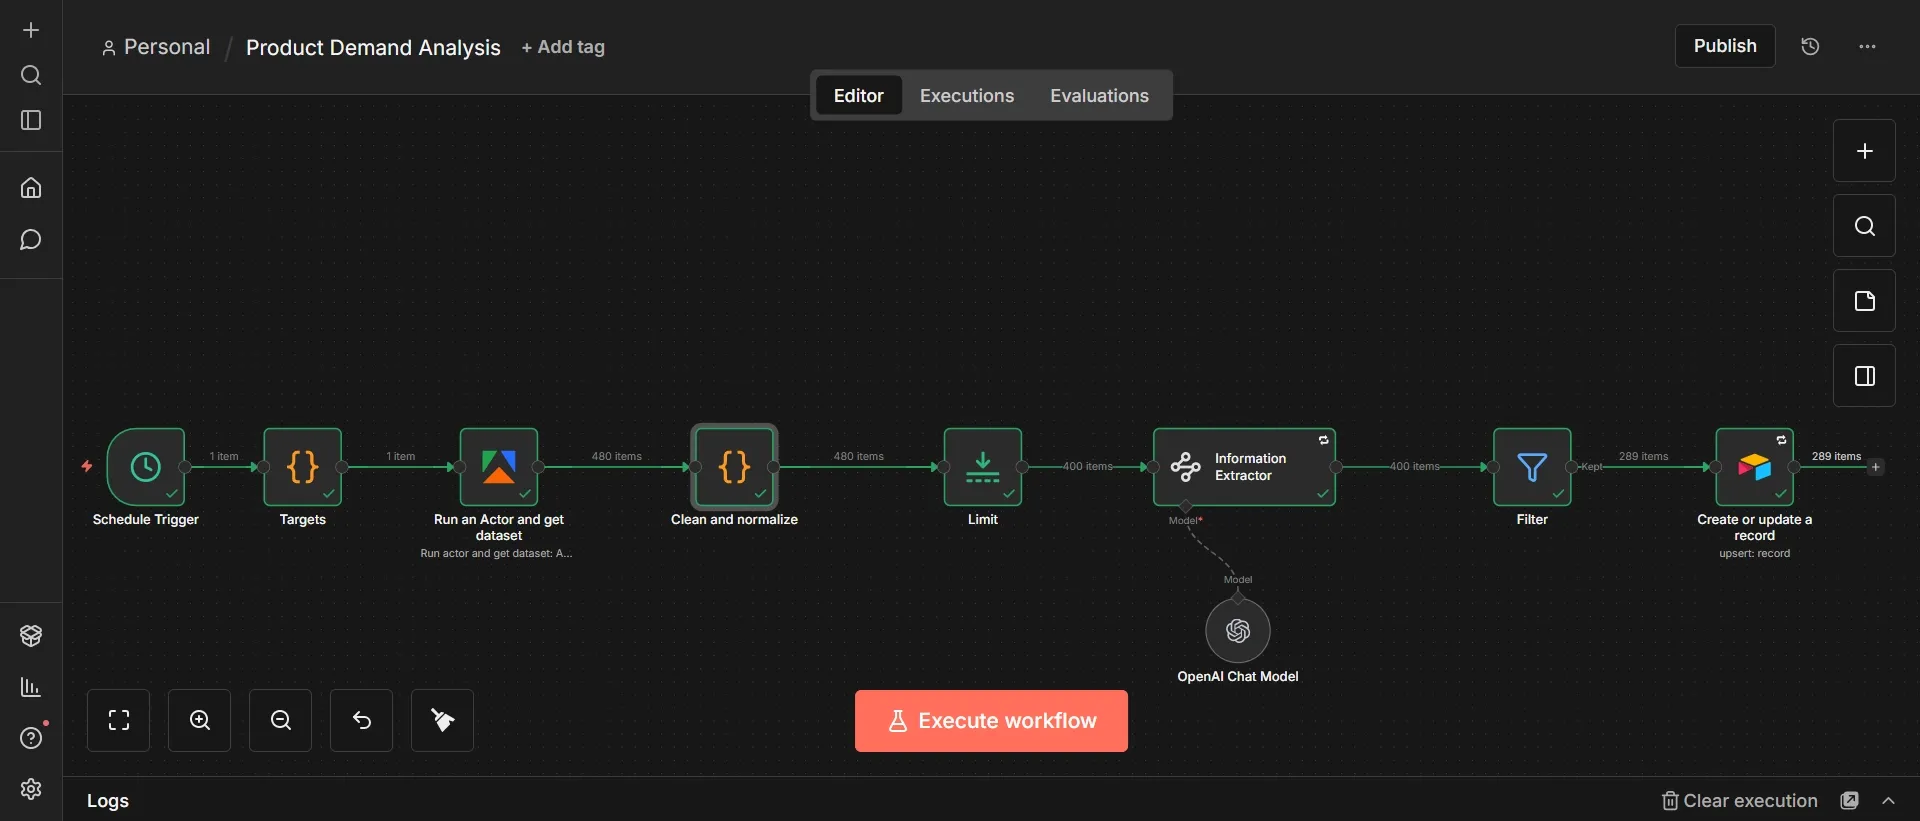
Phase 3: Build the product demand analysis workflow
The finished workflow looks like this, eight nodes in a single line, with an OpenAI Chat Model hanging off the Information Extractor as its language model:
Step #1: Schedule Trigger node
- Click the + icon (Add first step) to add the first node.
- Search for "Schedule Trigger" and select it.
- Set Trigger Interval to Weeks.
- Set Weeks Between Triggers to
1. - Set Trigger on Weekdays to Sunday.
- Set Trigger at Hour to Midnight.
- Set Trigger at Minute to
0.
This node starts the whole workflow on a fixed schedule, once a week, every Sunday at midnight. A weekly cadence fits the data: software reviews accumulate slowly, so checking once a week catches a fresh batch without re-scraping the same reviews every few hours and burning credits.

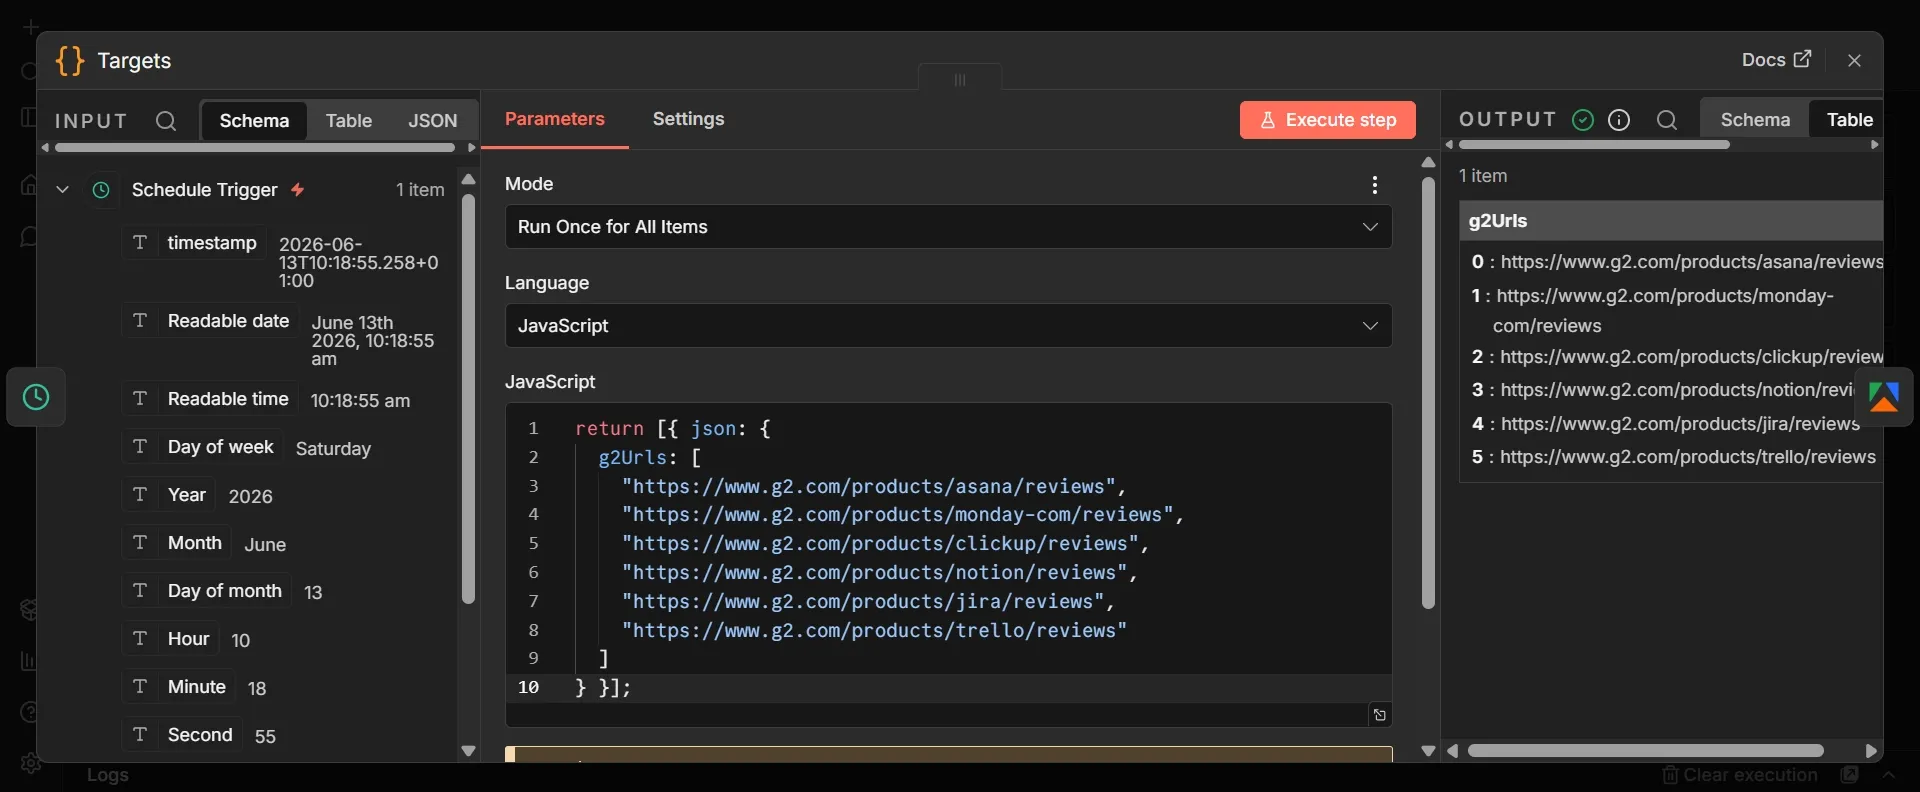
Step #2: Targets (Code) node
- From the Schedule Trigger's output, click + to add a new node.
- Search "Code", select Code, and add it. Rename this node to "Targets".
- Set Mode to Run Once for All Items and Language to JavaScript.
- Delete the boilerplate and paste the code below:
return [{ json: {
  g2Urls: [
    "https://www.g2.com/products/asana/reviews",
    "https://www.g2.com/products/monday-com/reviews",
    "https://www.g2.com/products/clickup/reviews",
    "https://www.g2.com/products/notion/reviews",
    "https://www.g2.com/products/jira/reviews",
    "https://www.g2.com/products/trello/reviews"
  ]
} }];
This node defines what you are analyzing. It outputs a single list of six G2 review pages, one per project management tool: Asana, Monday, ClickUp, Notion, Jira, and Trello. Keeping the targets in their own node means you change what you track in one place, without editing the scraper. Swap in any other G2 product review URLs to point the pipeline at a different category.
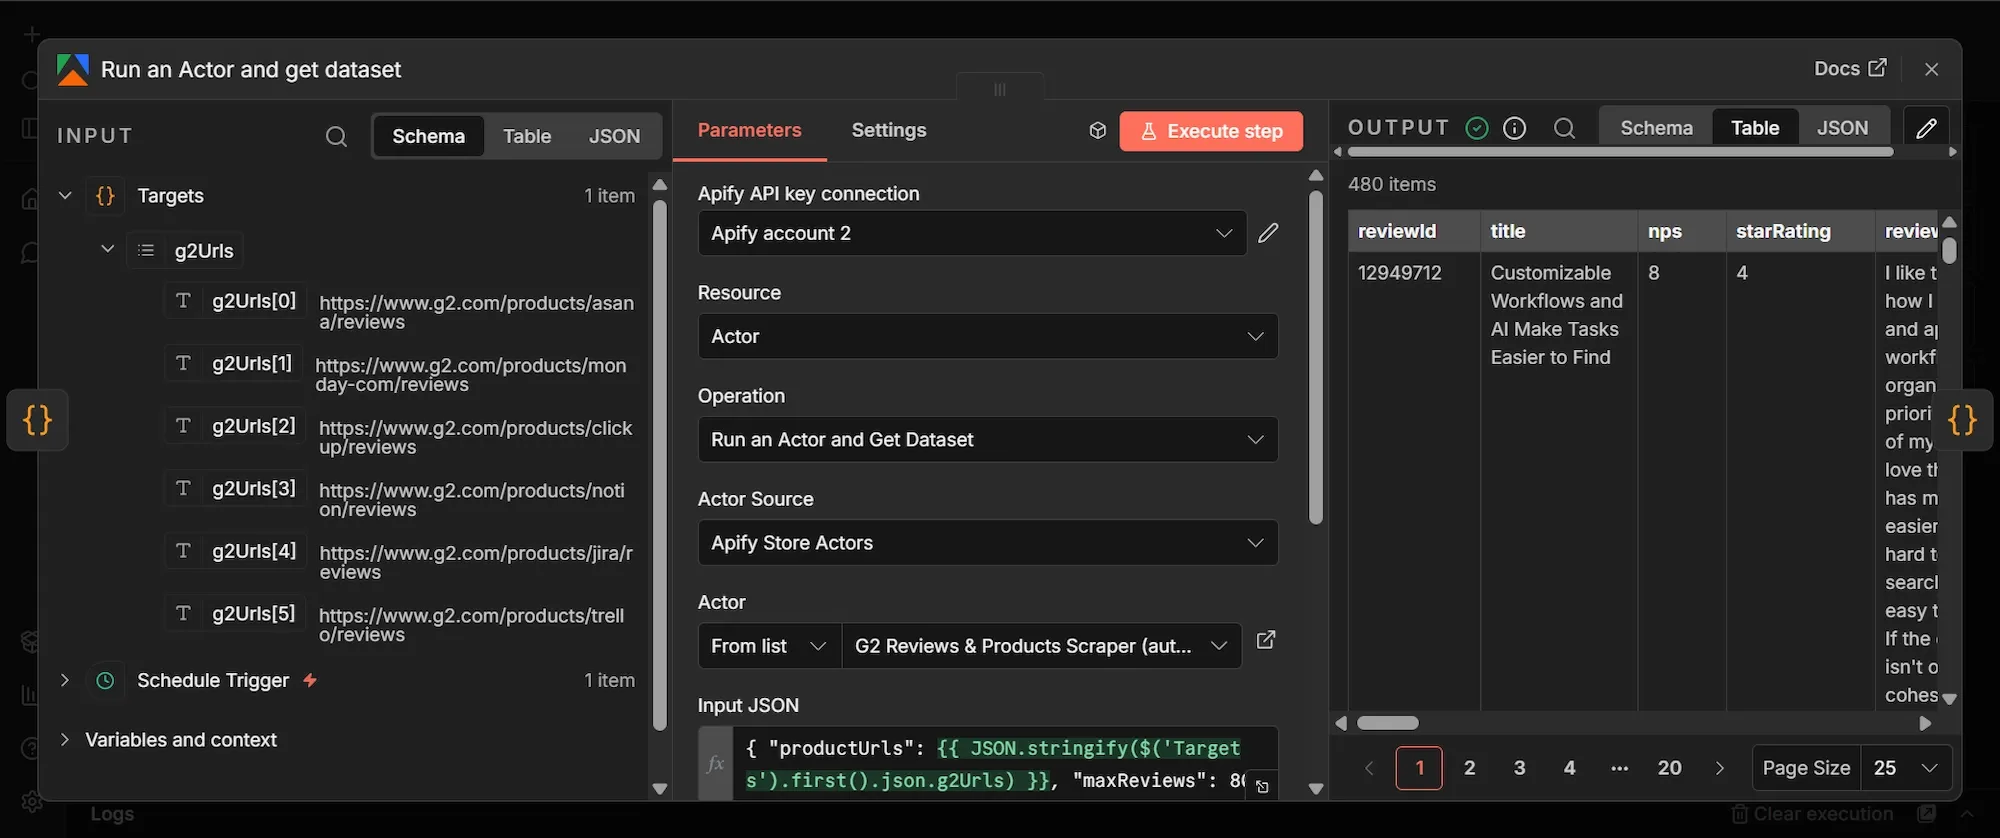
Step #3: Run an Actor and get dataset (Apify) node
- From the Targets node's output, click + to add a new node.
- Search "Apify", select Run an Actor and get dataset, and add it.
- Under Apify API key connection, click Create new credential, paste your Apify API token, and save.
- Set Resource to Actor and Operation to Run an Actor and Get Dataset.
- Set Actor Source to Apify Store Actors.
- Under Actor, choose From list and select "G2 Reviews & Products Scraper".
- In the Input JSON field, switch it to expression mode and paste this:
{ "productUrls": {{ JSON.stringify($('Targets').first().json.g2Urls) }}, "maxReviews": 80 }
This node does the scraping. It passes the six URLs from the Targets node to the Actor and asks for up to 80 reviews per product, returning 480 reviews in total. Each review comes back as a row with fields including reviewId (a unique ID), title (the review headline), starRating (1 to 5), nps (the reviewer's likelihood to recommend), and reviewText (the full written review). Those raw fields are what the next node cleans up.
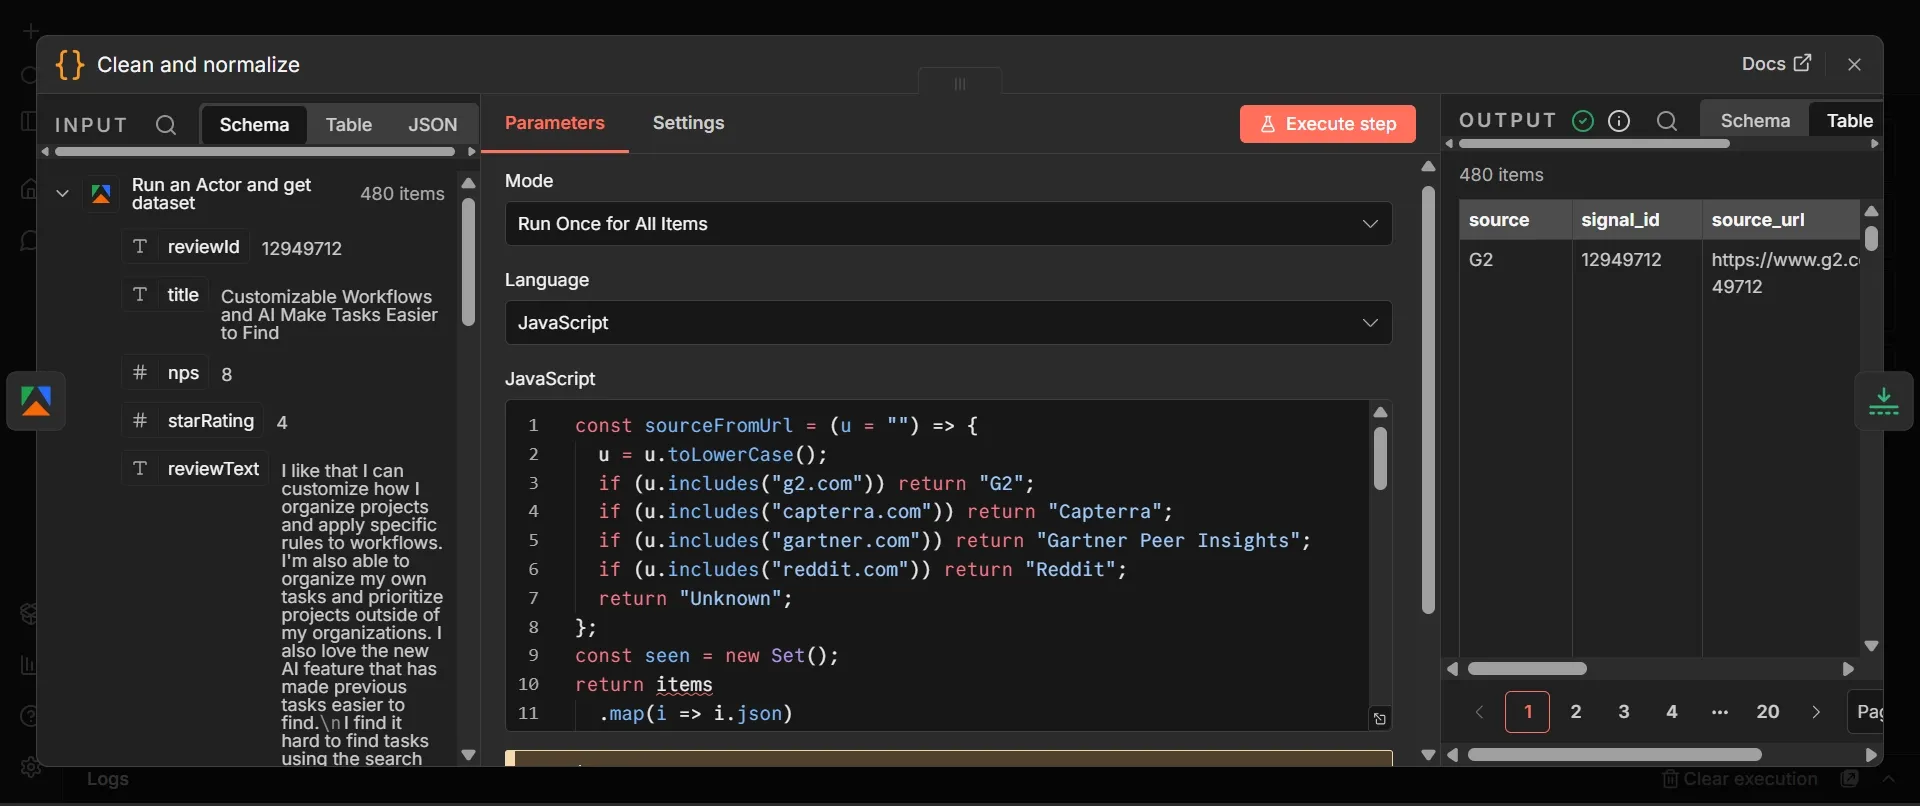
Step #4: Clean and normalize (Code) node
- From the Apify node's output, click + to add a new node.
- Search "Code", select Code, and add it. Rename this node to "Clean and normalize".
- Set Mode to Run Once for All Items and Language to JavaScript.
- Delete the boilerplate and paste the code below:
// Map each review's URL to a clean, consistent source label
const sourceFromUrl = (u = "") => {
  u = u.toLowerCase();
  if (u.includes("g2.com")) return "G2";
  if (u.includes("capterra.com")) return "Capterra";
  if (u.includes("gartner.com")) return "Gartner Peer Insights";
  if (u.includes("reddit.com")) return "Reddit";
  return "Unknown";
};

// Pull a tidy product name out of the G2 URL slug
const productFromUrl = (u = "") => {
  const match = u.match(/products\/([^/]+)/);
  if (!match) return "Unknown";
  return match[1]
    .replace(/-/g, " ")
    .replace(/\bcom\b/i, "")
    .trim()
    .replace(/\b\w/g, (c) => c.toUpperCase());
};

const seen = new Set();
const out = [];

items.forEach((item, index) => {
  const r = item.json;
  const id = String(r.reviewId ?? "");

  // Skip any review with no ID, and skip duplicates
  if (!id || seen.has(id)) return;
  seen.add(id);

  const url = r.reviewUrl || r.url || r.link || "";
  const title = (r.title || "").trim();
  const body = (r.reviewText || r.text || "").trim();

  // Skip empty reviews
  if (!title && !body) return;

  out.push({
    json: {
      source: sourceFromUrl(url),
      signal_id: id,
      source_url: url,
      product: r.product || productFromUrl(url),
      review_date: r.reviewDate || r.publishedAt || r.date || new Date().toISOString(),
      text: title ? `${title} | ${body}` : body,
    },
    pairedItem: { item: index },
  });
});

return out;
This node turns messy HTML into clean, predictable rows and removes duplicate reviews using the unique ID. It drops empty reviews, derives a tidy source and product name from the URL, and merges the headline and body into one text field for the model to read. Then it returns six columns:
source: the site label, (G2).signal_id: the review's unique ID, carried through so Airtable can match on it.source_url: the link back to the original review.product: the software the review is about.review_date: when the review was posted.text: the headline and review body joined together, which is the single piece of text the model analyzes.
The pairedItem line at the bottom of your code matters more than it looks. It tags each output row with the input row it came from, which lets the Airtable node later pull the source, product, and the rest back out of this node.
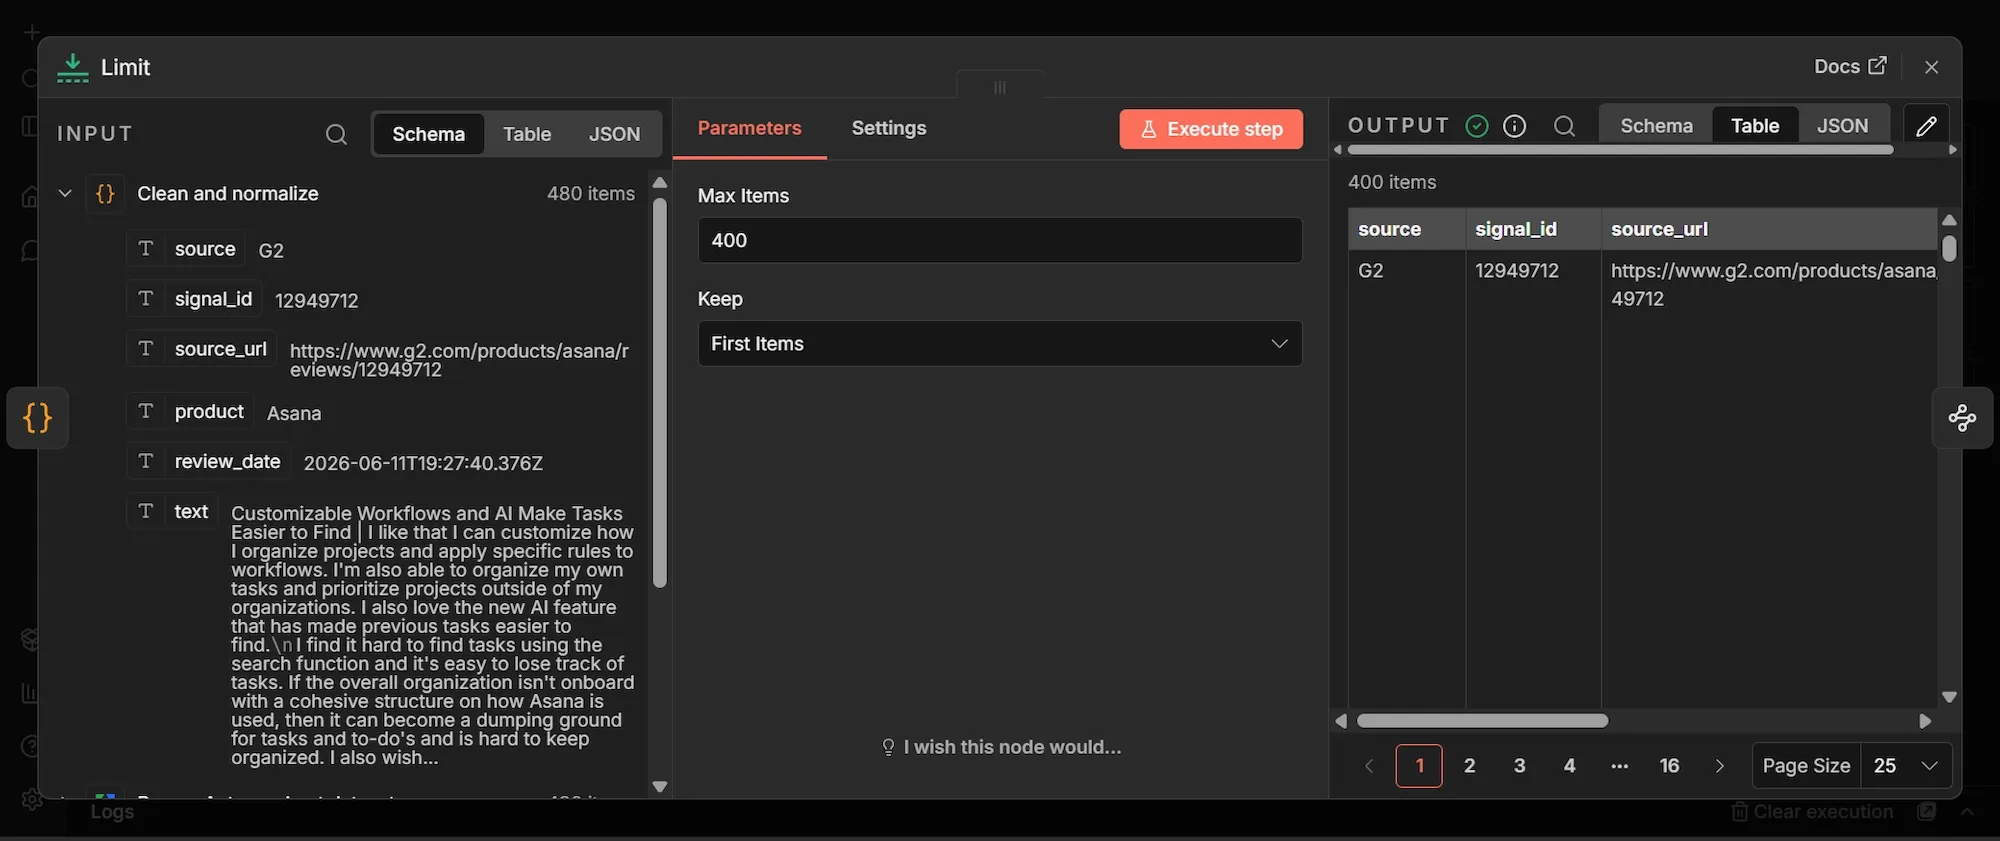
Step #5: Limit node
- From the Clean and normalize node's output, click + to add a new node.
- Search "Limit", select Limit, and add it.
- Set Max Items to
400. - Set Keep to First Items.
This node caps the number of reviews that move on to the paid reasoning step. The model is called once per row, cost and speed matter. Keeping the first 400 of the 480 cleaned reviews keeps each run predictable while you’re building and testing. You can then raise or lower it once you know how much you want to spend per run.
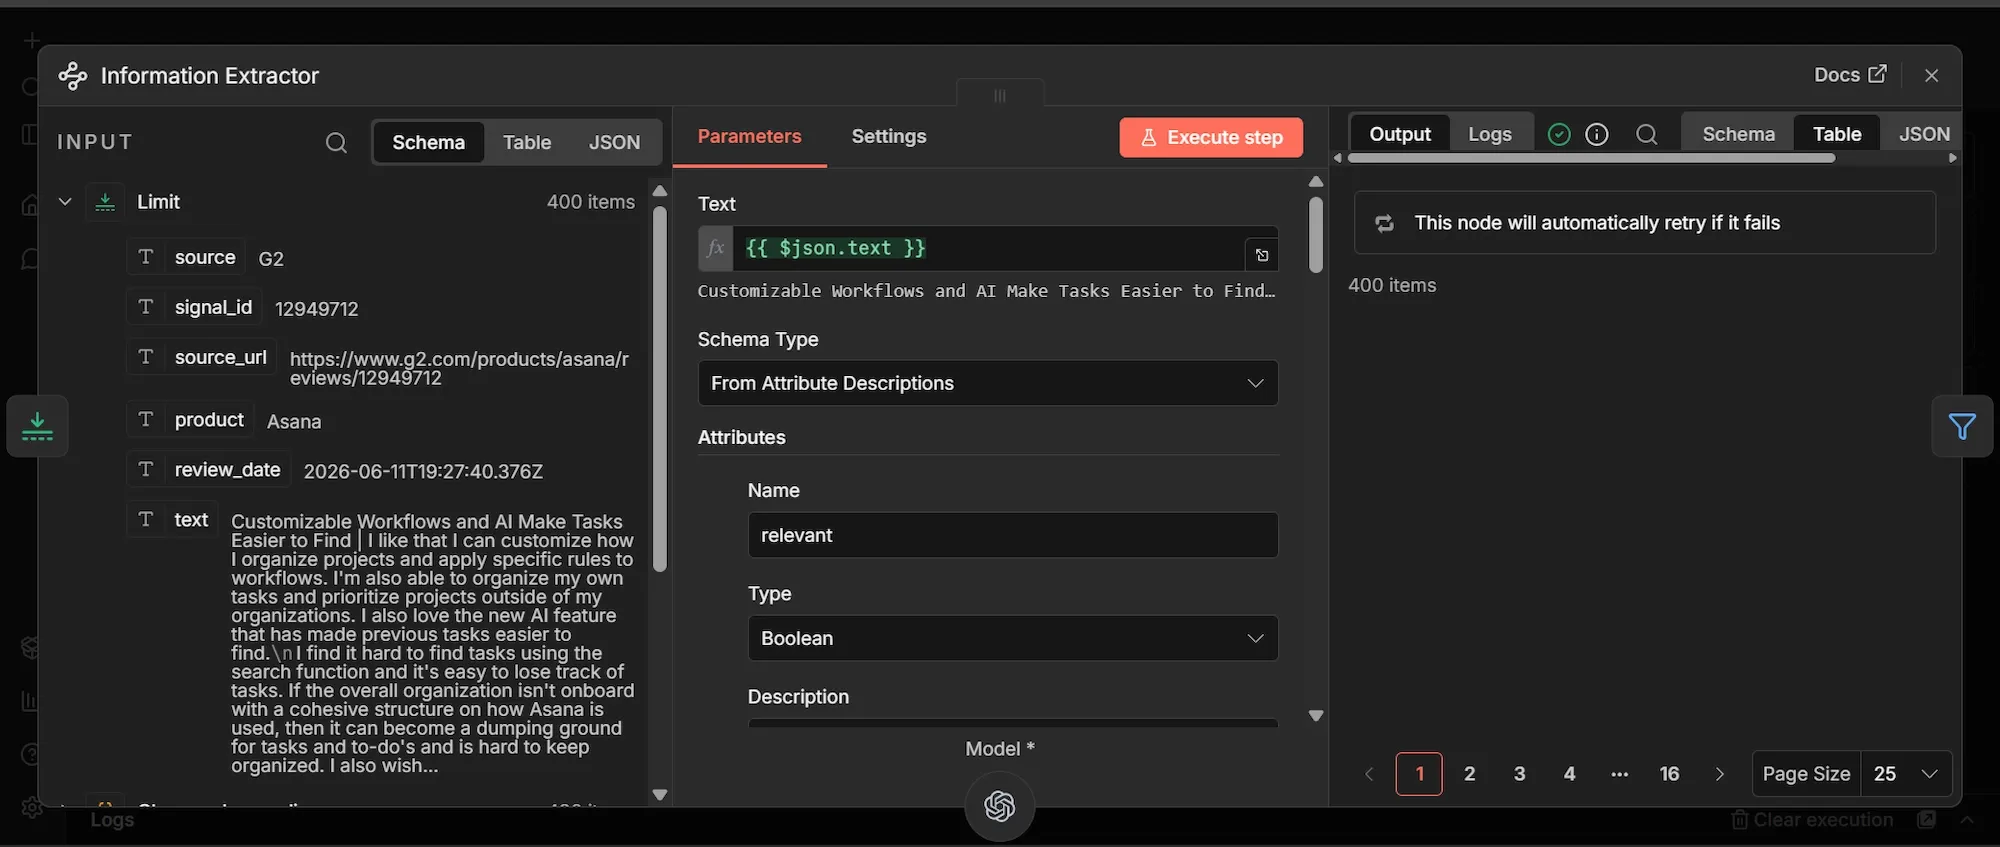
Step #6: Information Extractor node
- From the Limit node's output, click + to add a new node.
- Search "Information Extractor", select it, and add it.
- In the Text field, switch to expression mode and enter
{{ $json.text }}. - Set Schema Type to From Attribute Descriptions.
- Under Attributes, click Add attribute and create these six, one at a time. For each, set the Name, the Type, and the Description.
| Name | Type | Description |
|---|---|---|
relevant |
Boolean | True only if the review expresses a concrete product demand signal: a missing feature, an unmet need, a complaint about something the product does badly, or a request for something it does not do. False for generic praise, vague comments, or anything with no actionable signal. |
signal_type |
String | The category of the signal. Return exactly one of: missing_feature, pricing_friction, quality_issue, integration_gap, usability_friction, other. |
pain_point |
String | One sentence, in the reviewer's own framing, describing the specific unmet need or frustration. Return an empty string if relevant is false. |
has_workaround |
Boolean | True if the reviewer mentions a workaround, hack, or alternative they currently use to cope with the problem. Otherwise false. |
intensity |
String | How strongly the reviewer feels about the pain point. Return exactly one of: low, medium, high. |
demand_cluster |
String | A short theme label that groups similar pain points, such as mobile_experience, reporting, or automation. Return uncategorized if you cannot confidently assign one. |
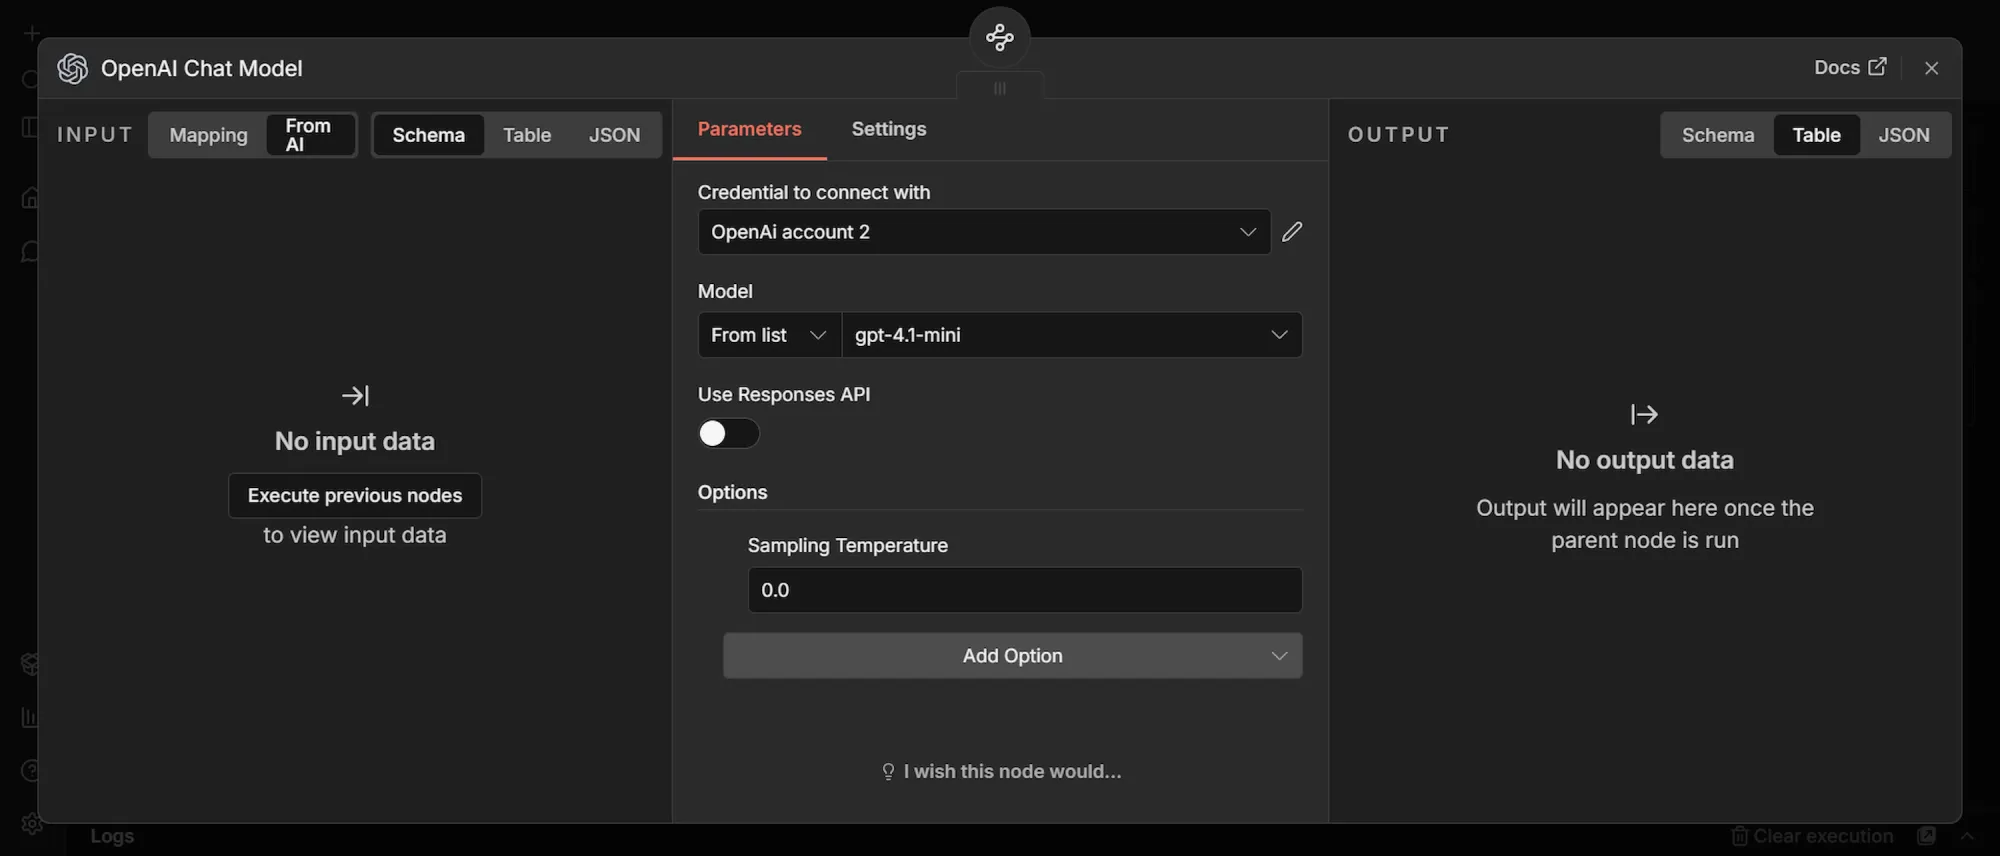
Now attach the OpenAI model that applies the reasoning layer.
- On the Information Extractor node, click the small Model connector underneath it.
- Search "OpenAI Chat Model" and add it.
- Under Credential to connect with, click Create new credential, paste your OpenAI API key, and save.
- Set Model to From list and choose
gpt-4.1-mini. - Leave Use Responses API off.
- Set Sampling Temperature to
0.0.
It reads each review's text and returns a structured judgment: whether it's a real demand signal, what kind it is, what the pain is in one sentence, whether the user found a workaround, how intense it is, and which theme it belongs to. This build uses gpt-4.1-mini because it’s cheap and accurate enough for this kind of classification, and the temperature is set to 0.0, so the same review always returns the same answer, which keeps your dataset consistent across runs.
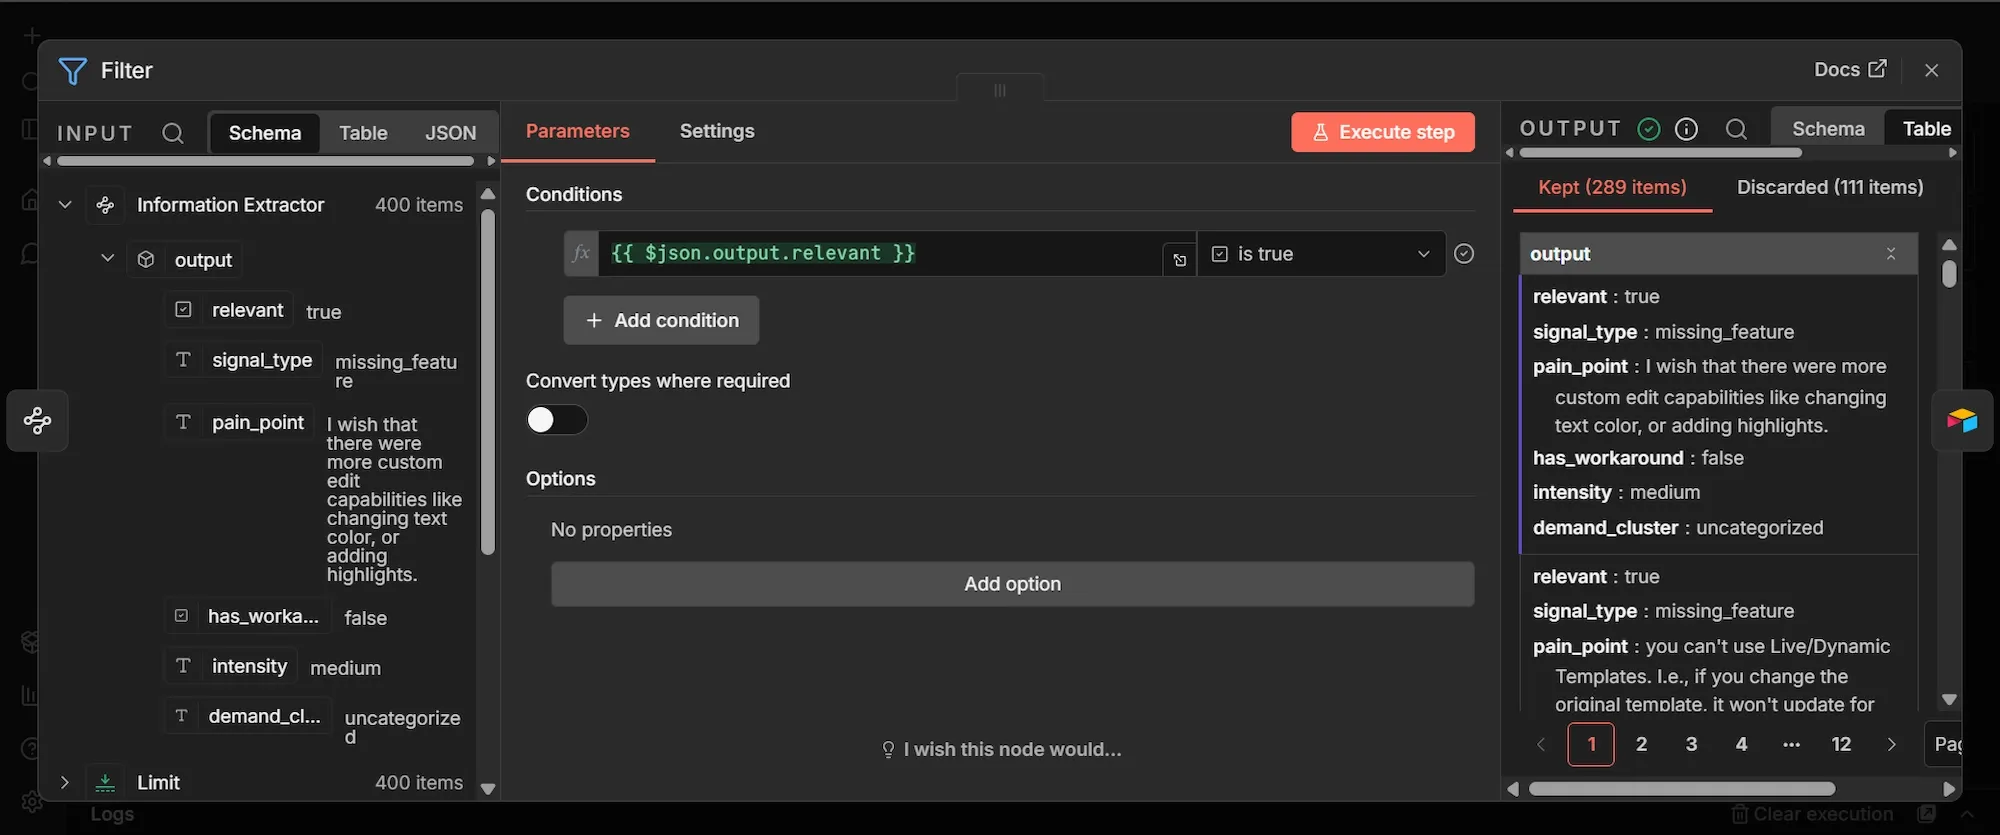
Step #7: Filter node
- From the Information Extractor node's output, click + to add a new node.
- Search "Filter", select Filter, and add it.
- Under Conditions, set Value 1 to
{{ $json.output.relevant }}in expression mode. - Set the operator to is true.
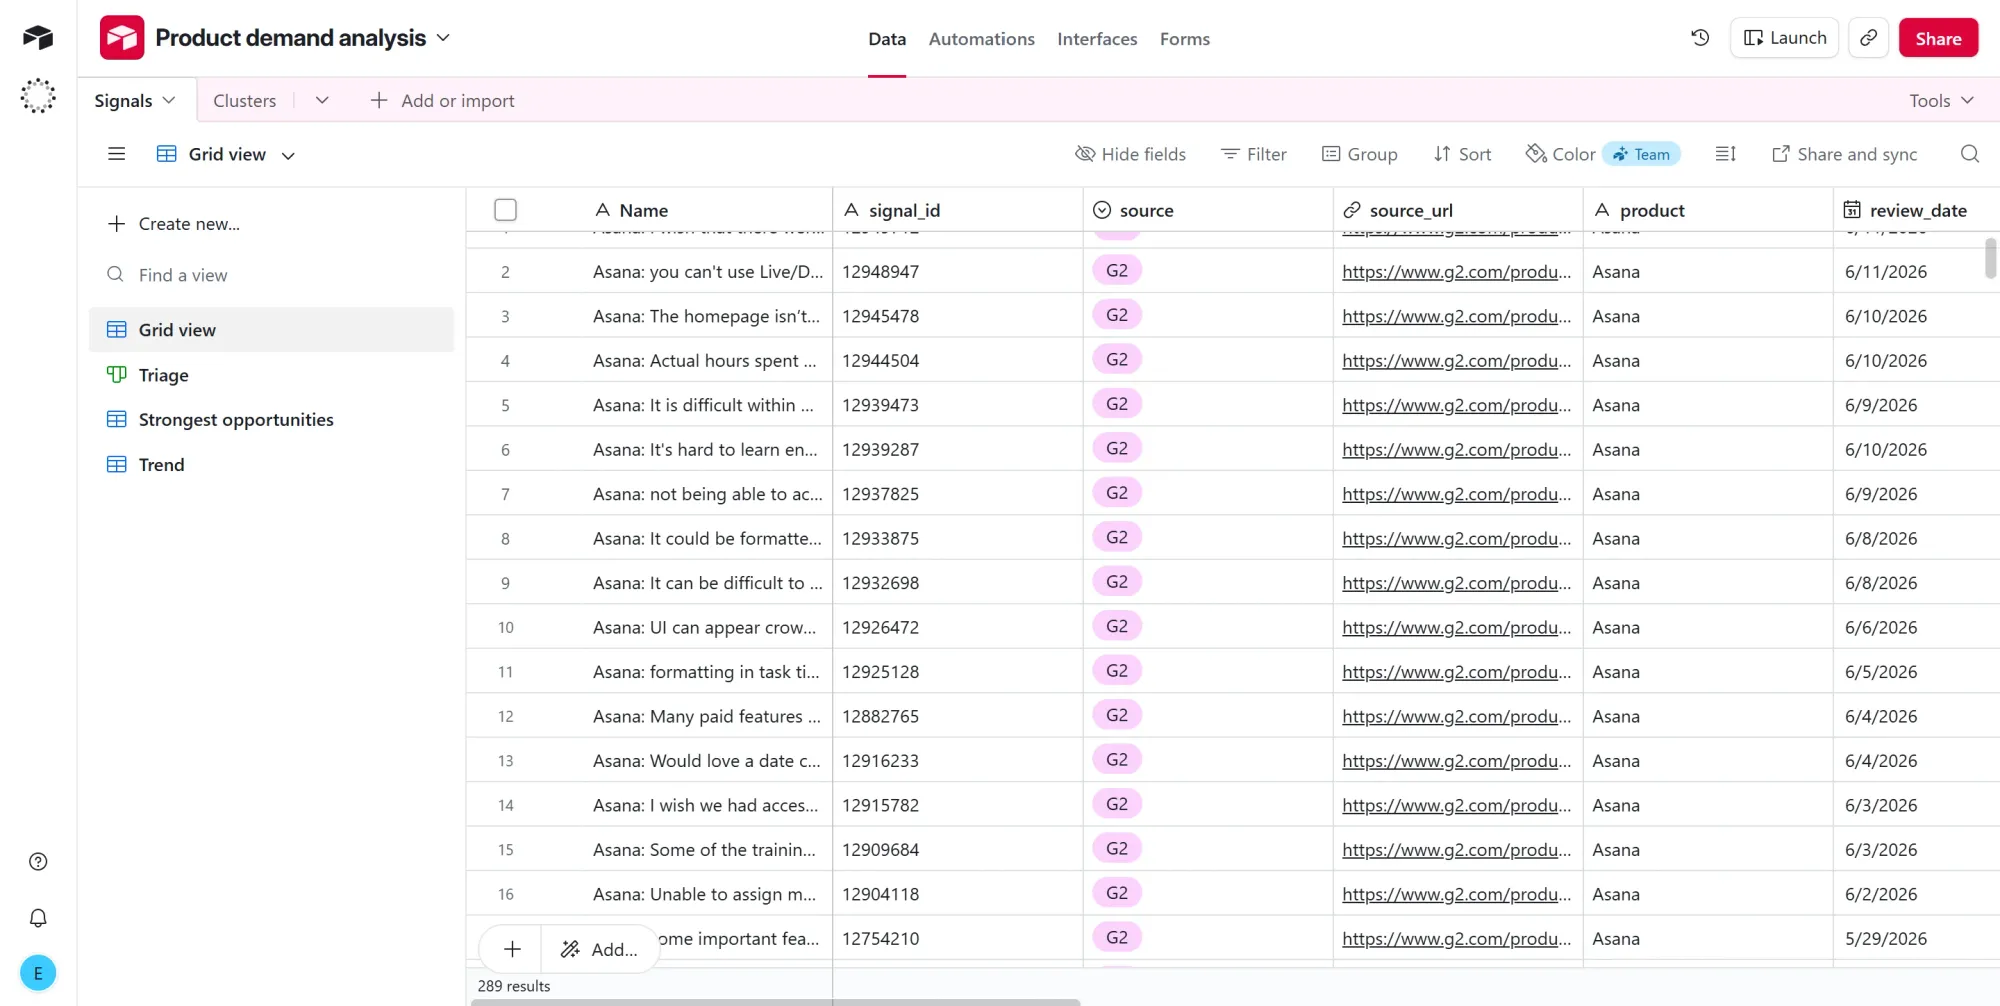
This node retains only the reviews that the model flagged as genuine demand signals and discards the rest. In a sample run of 400 reviews, 289 were left, and 111 were discarded as noise.
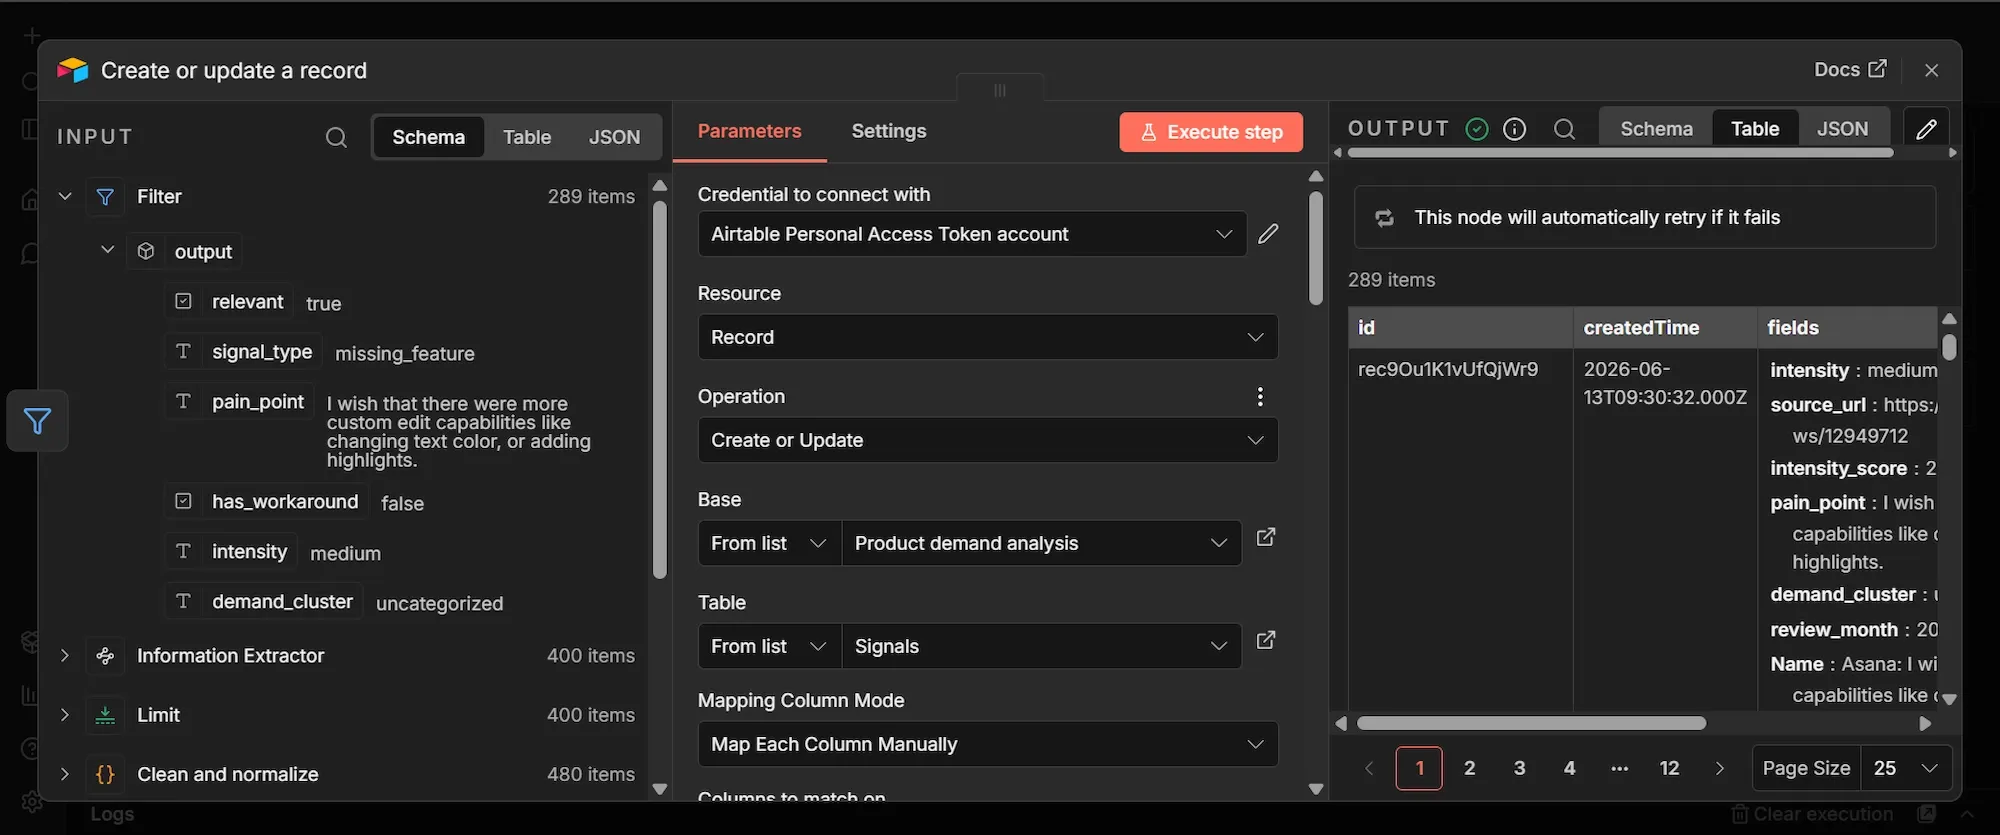
Step #8: Create or update a record (Airtable) node
- From the Filter node's output, click + to add a new node.
- Search "Airtable", select Create or update a record, and add it.
- Under Credential to connect with, click Create new credential, paste your Airtable personal access token, and save.
- Set Resource to Record and Operation to Create or Update.
- Under Base, choose From list and select your Product demand analysis base.
- Under Table, choose From list and select Signals.
- Set Mapping Column Mode to Map Each Column Manually.
- Set the column to match on to
signal_id. - Map each of the 12 columns to the expression below. Switch each field to expression mode before pasting.
| Airtable column | Expression |
|---|---|
Name |
{{ $('Clean and normalize').item.json.product }}: {{ $json.output.pain_point }} |
signal_id |
{{ $('Clean and normalize').item.json.signal_id }} |
source |
{{ $('Clean and normalize').item.json.source }} |
product |
{{ $('Clean and normalize').item.json.product }} |
source_url |
{{ $('Clean and normalize').item.json.source_url }} |
review_month |
{{ $('Clean and normalize').item.json.review_date.slice(0, 7) }} |
signal_type |
{{ $json.output.signal_type }} |
pain_point |
{{ $json.output.pain_point }} |
has_workaround |
{{ $json.output.has_workaround }} |
intensity |
{{ $json.output.intensity }} |
intensity_score |
{{ ({ low: 1, medium: 2, high: 3 })[$json.output.intensity] }} |
demand_cluster |
{{ $json.output.demand_cluster }} |
Now, this node writes the finished signals into Airtable. Two of the columns are built here rather than coming straight from the model: review_month takes the first seven characters of the review date to give you a year and month, and intensity_score converts the text rating into a number (low becomes 1, medium becomes 2, high becomes 3) so you can sort and average it inside Airtable.
Phase 4: Execute, test, and publish
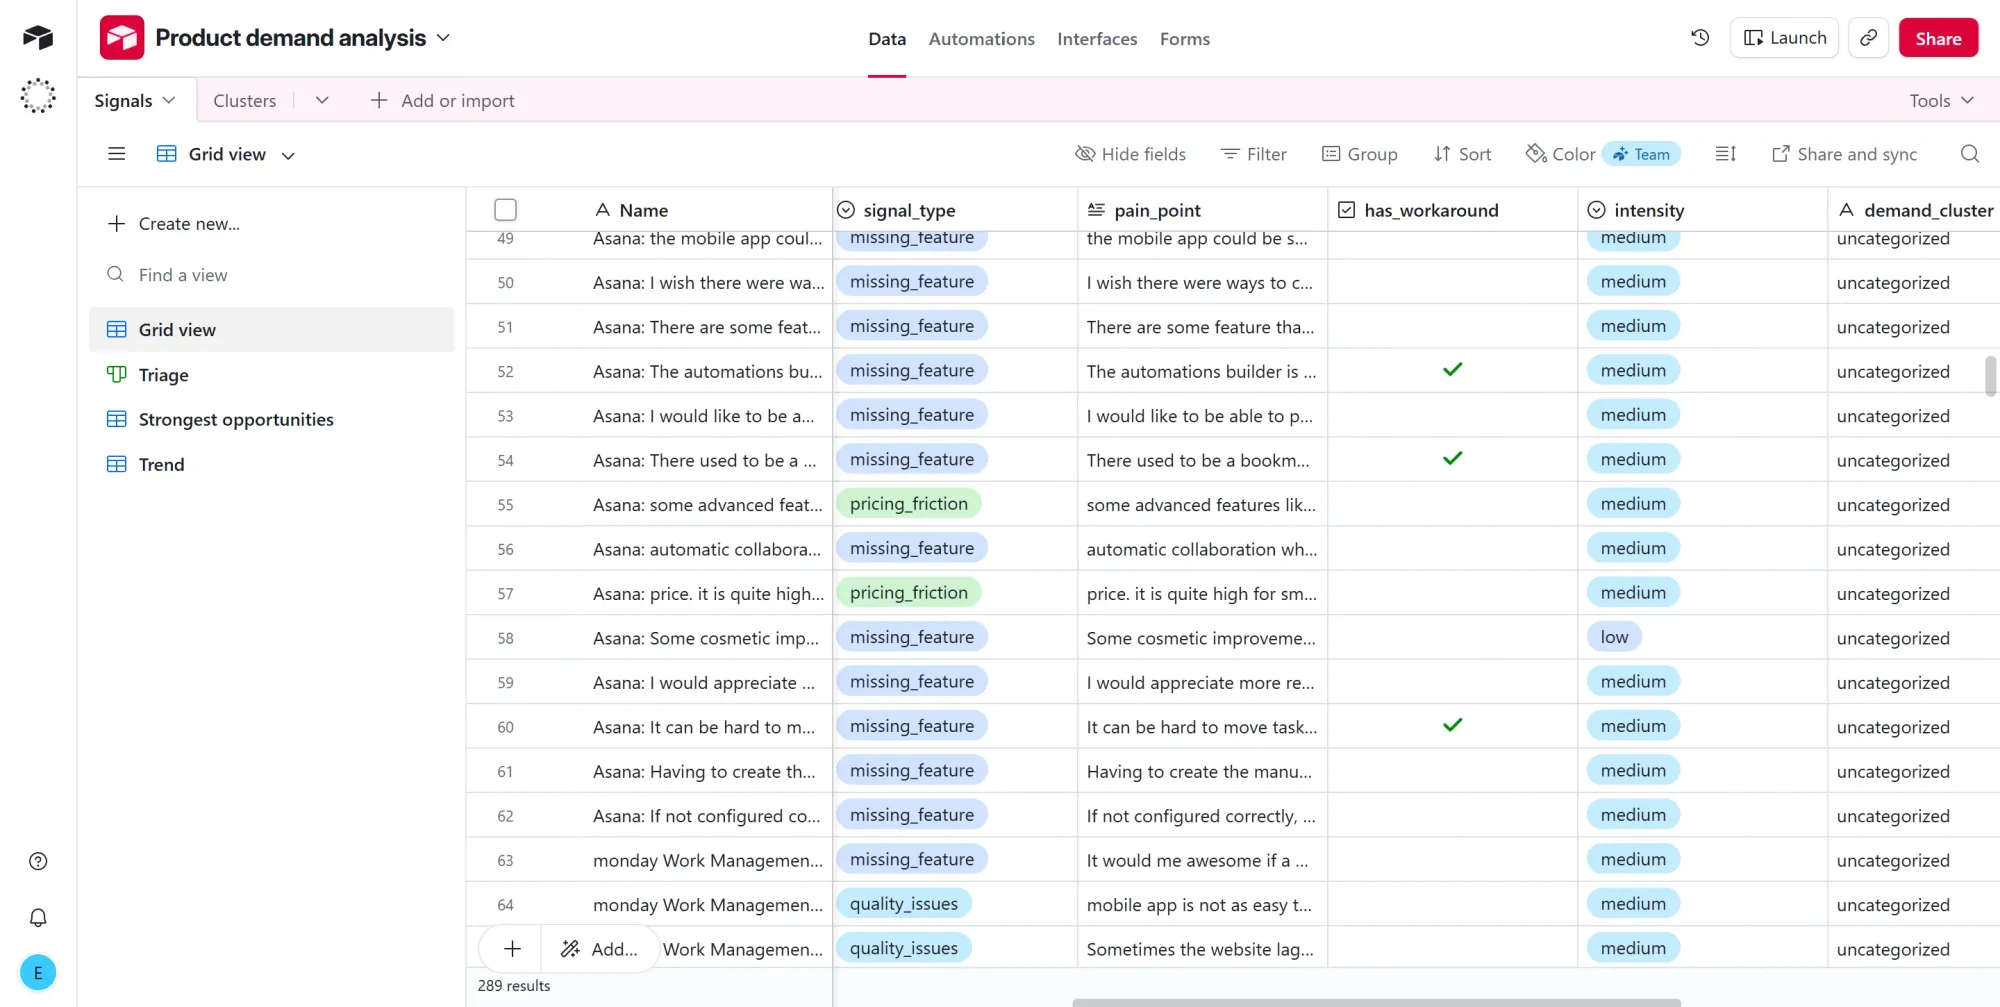
Step #1: Run the workflow and check the output
- Click Execute workflow and watch the nodes turn green one by one.
- Open your Airtable base and confirm rows are landing in the Signals table.
Step #2: Build the dashboard in Airtable
Airtable Interfaces allows you to build visual infographics from your data, turning the Signals table into an interactive, live dashboard. Here’s how to set it up:
- Open the Interfaces tab at the top, click New interface, and choose the Dashboard layout with the Signals table as its source. Name the page "Dashboard." The layout automatically adds a few starter elements, so remove any you don't want before adding the elements below.
First, add three headline metrics across the top.
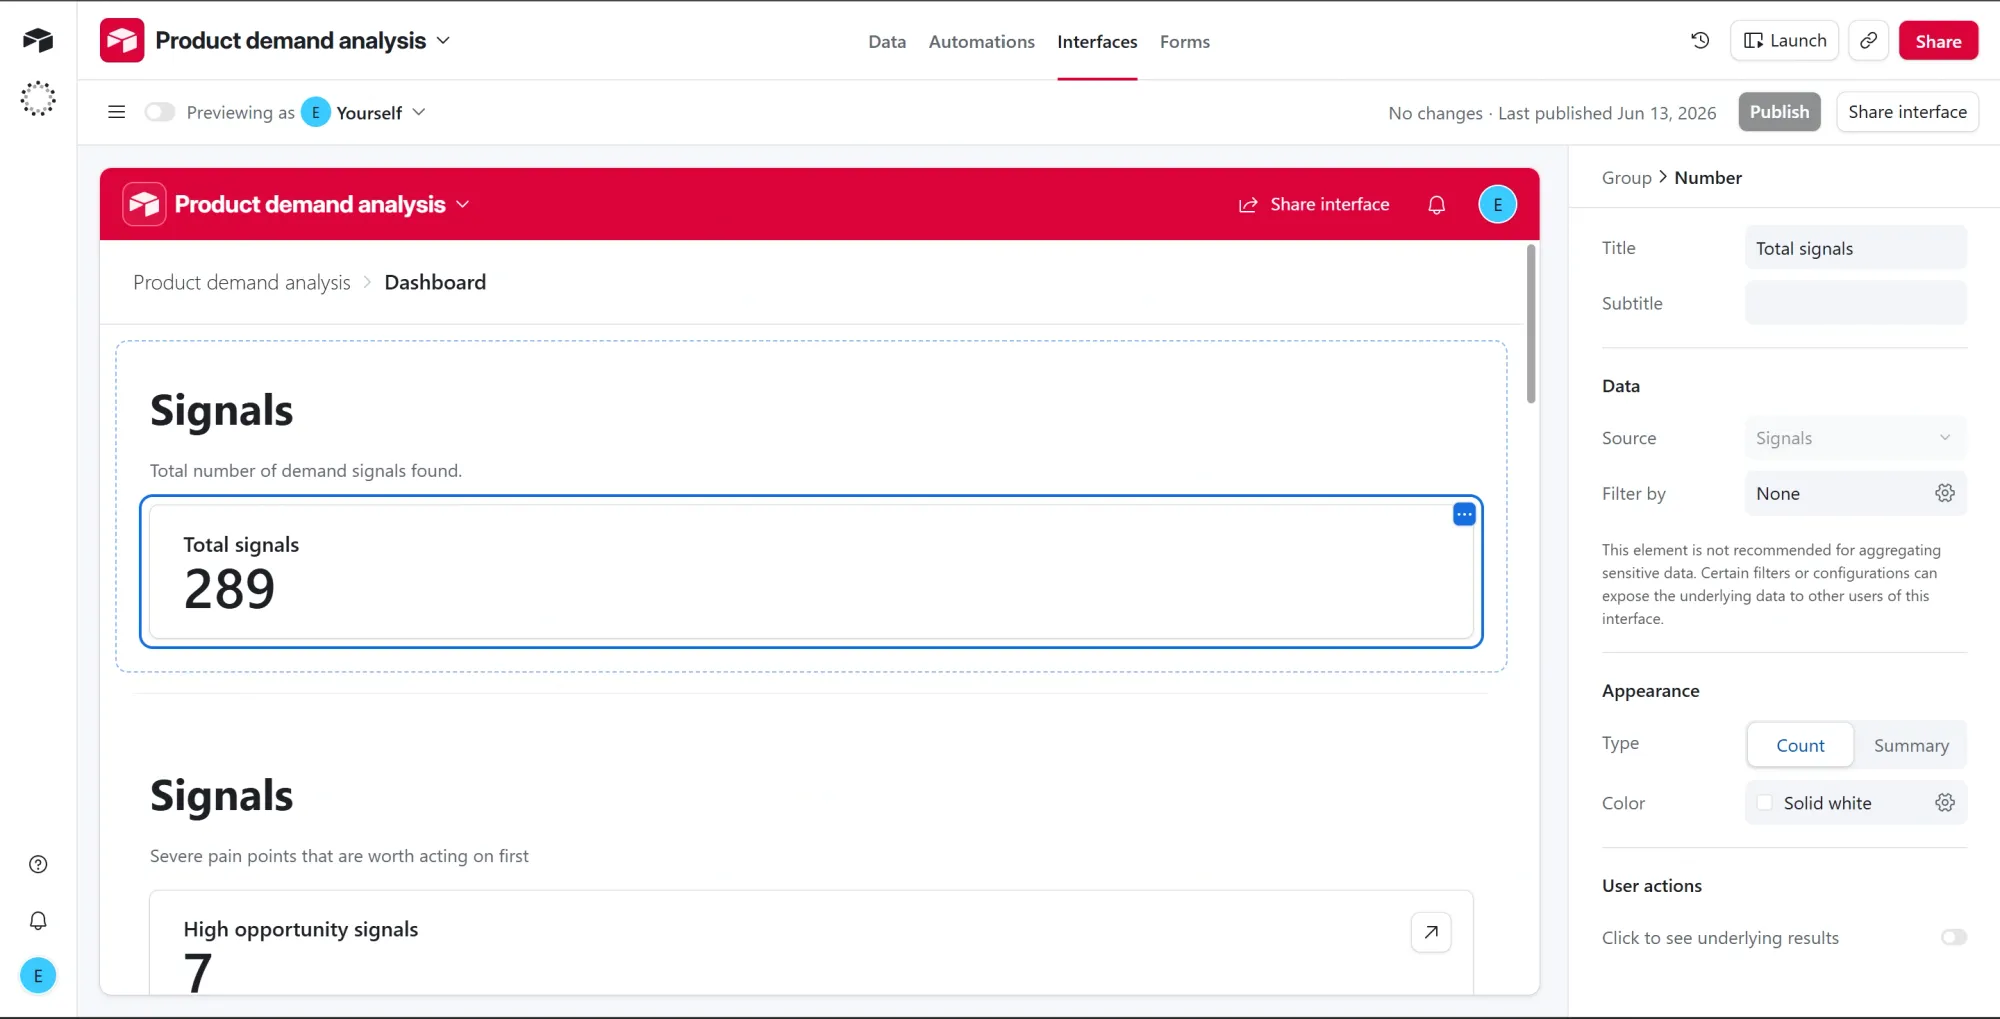
Metric 1: Total signals
- Click + Add group on the canvas and choose Number.
- Set the source to Signals.
- Set the calculation to Count of records.
- Leave the filter empty so it counts every row.
- Title it "Total signals." This is the total number of demand signals found (289 in this run).
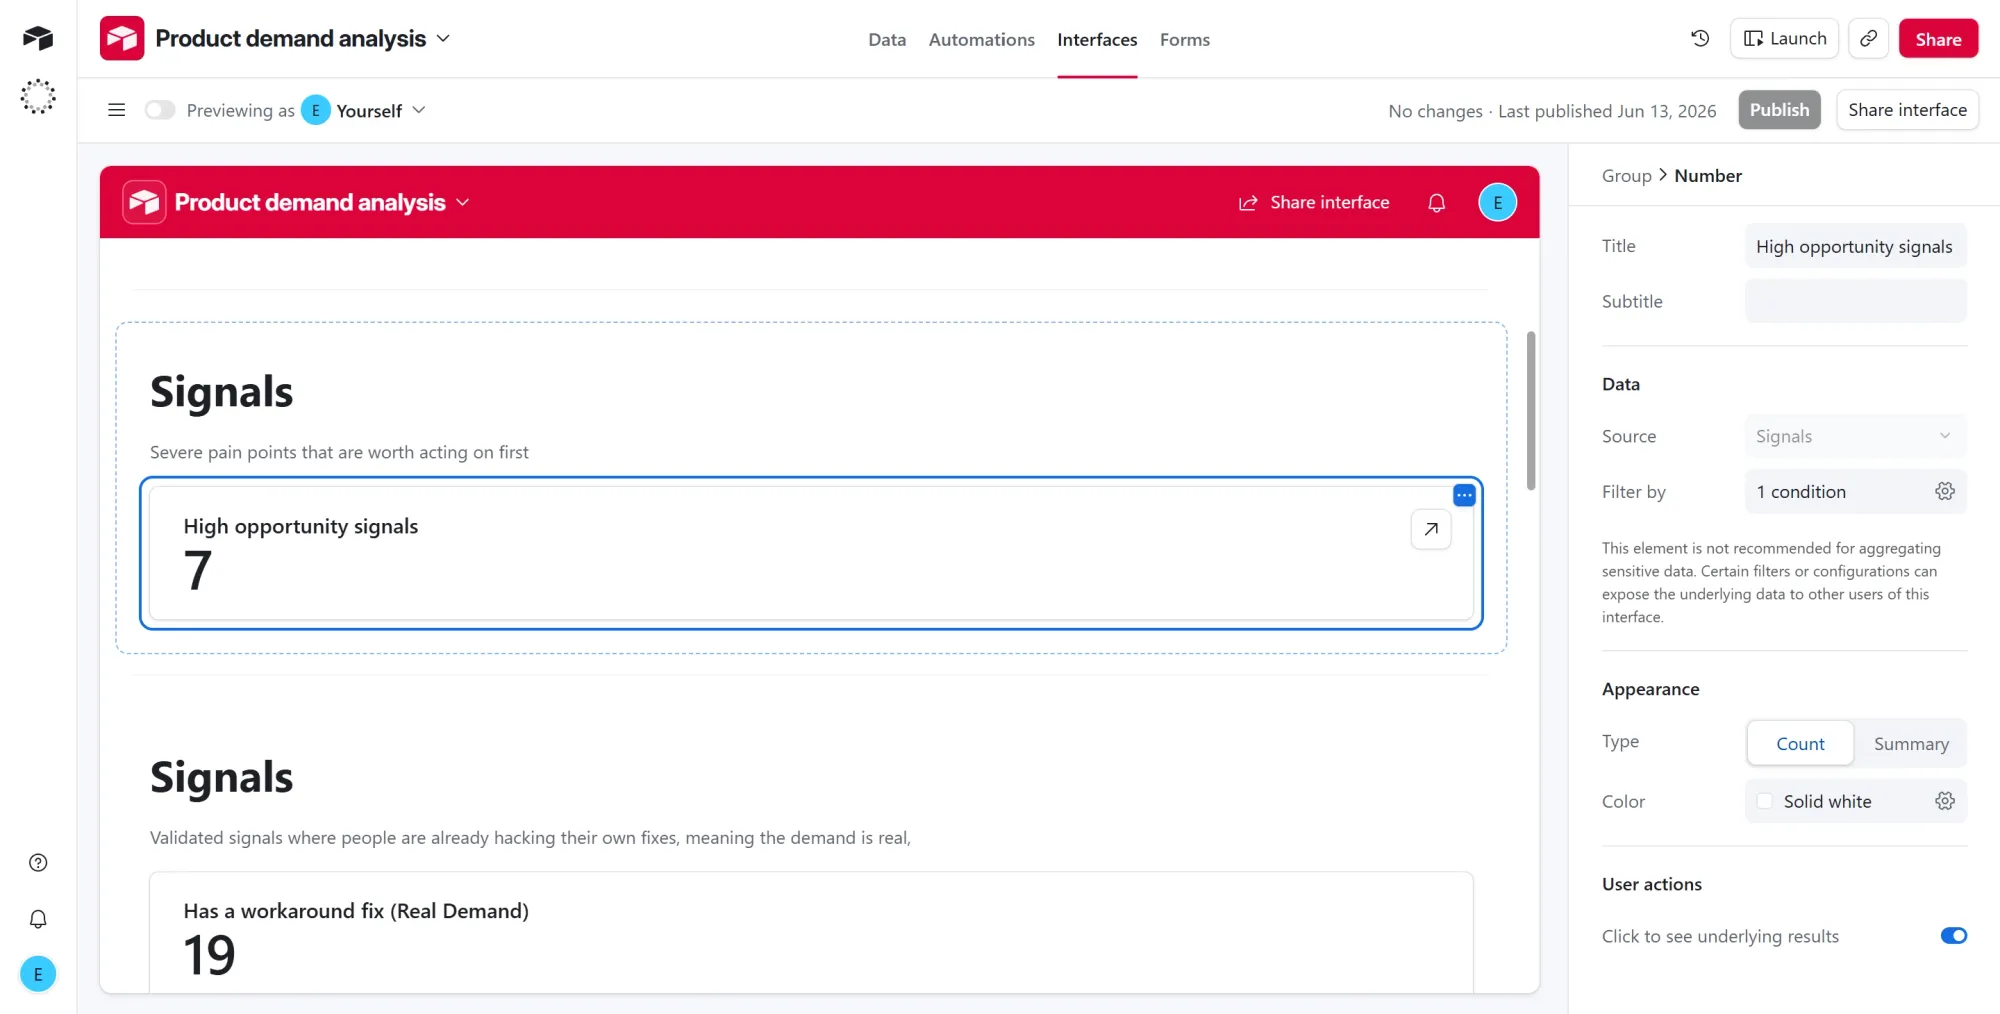
Metric 2: High opportunity signals
- Click + Add group on the canvas and choose Number.
- Set the source to Signals.
- Set the calculation to Count of records.
- Add a filter where
intensityishigh. - Title it "High opportunity signals." These are the severe pain points worth acting on first (7 here).
Metric 3: Has a workaround fix
- Click + Add group on the canvas and choose Number.
- Set the source to Signals.
- Set the calculation to Count of records.
- Add a filter where
has_workaroundis checked. - Title it "Has a workaround fix." A user who built their own hack is proof the demand is real, not idle wishing (19 here).
Then add the four charts.
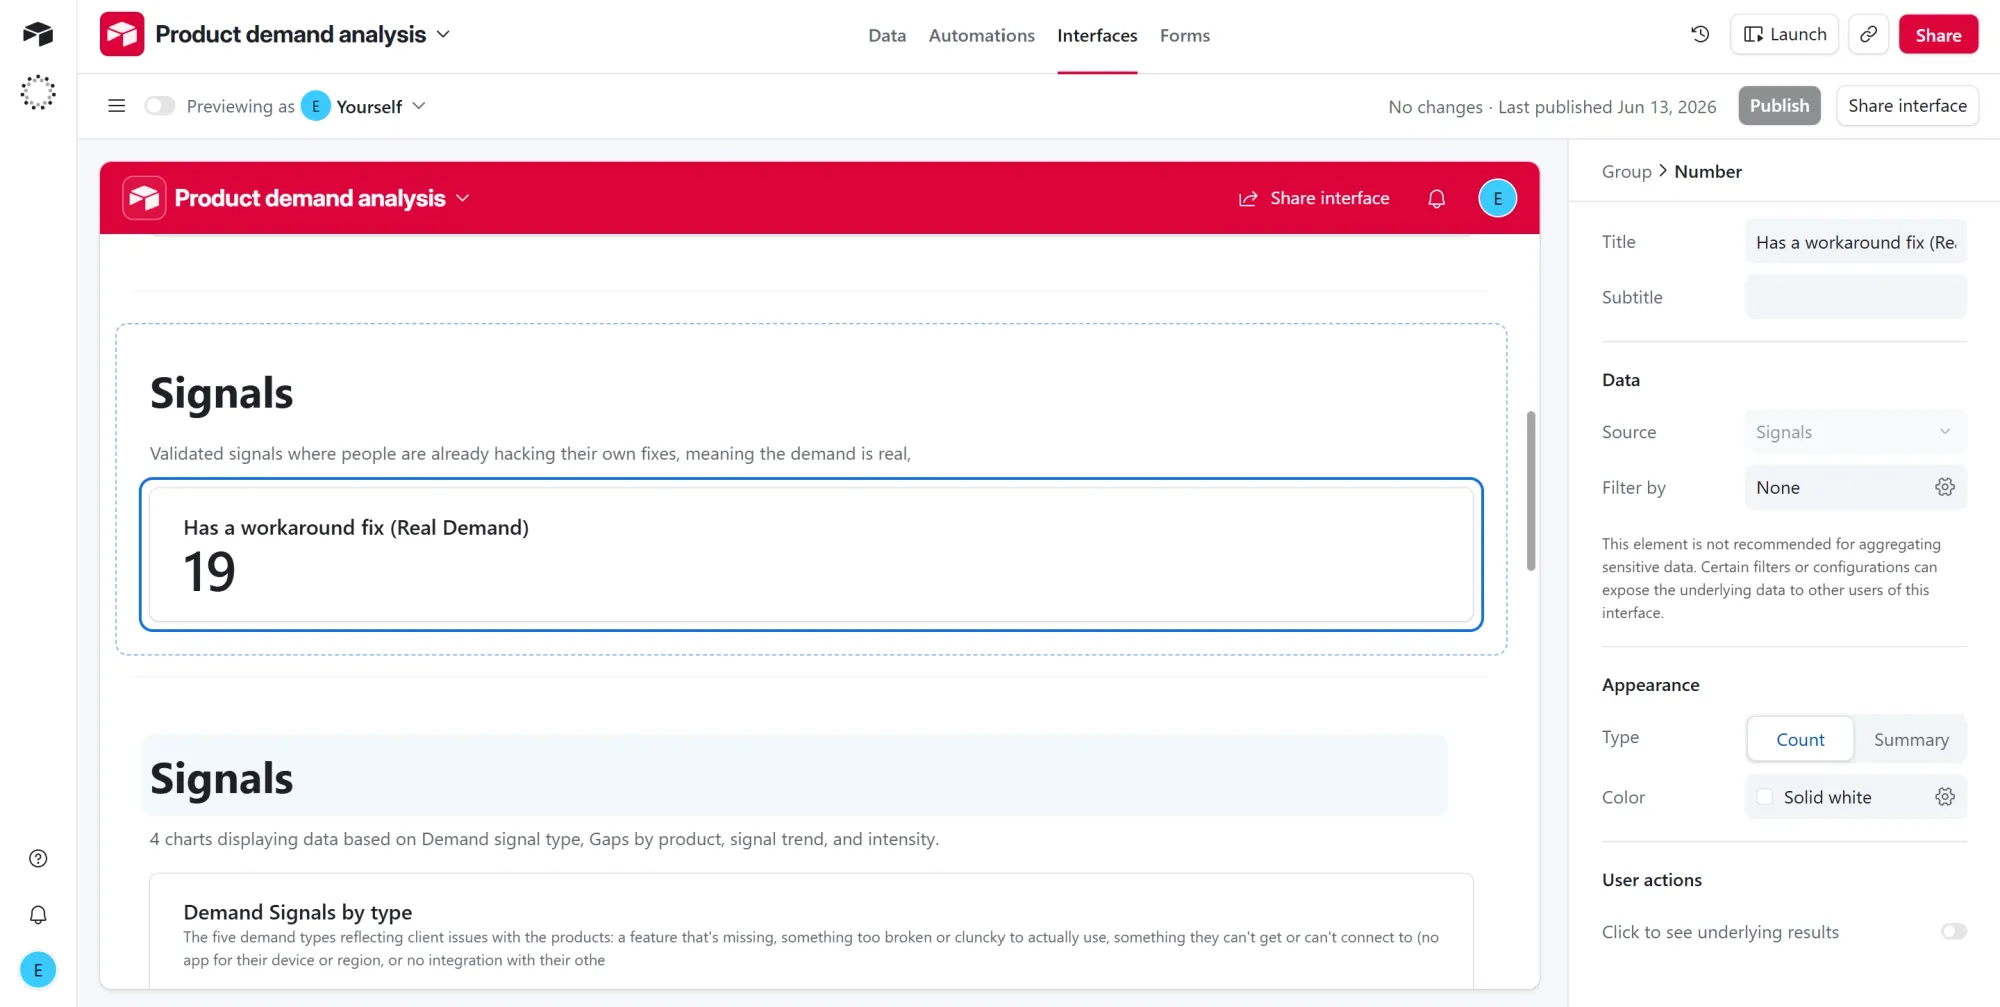
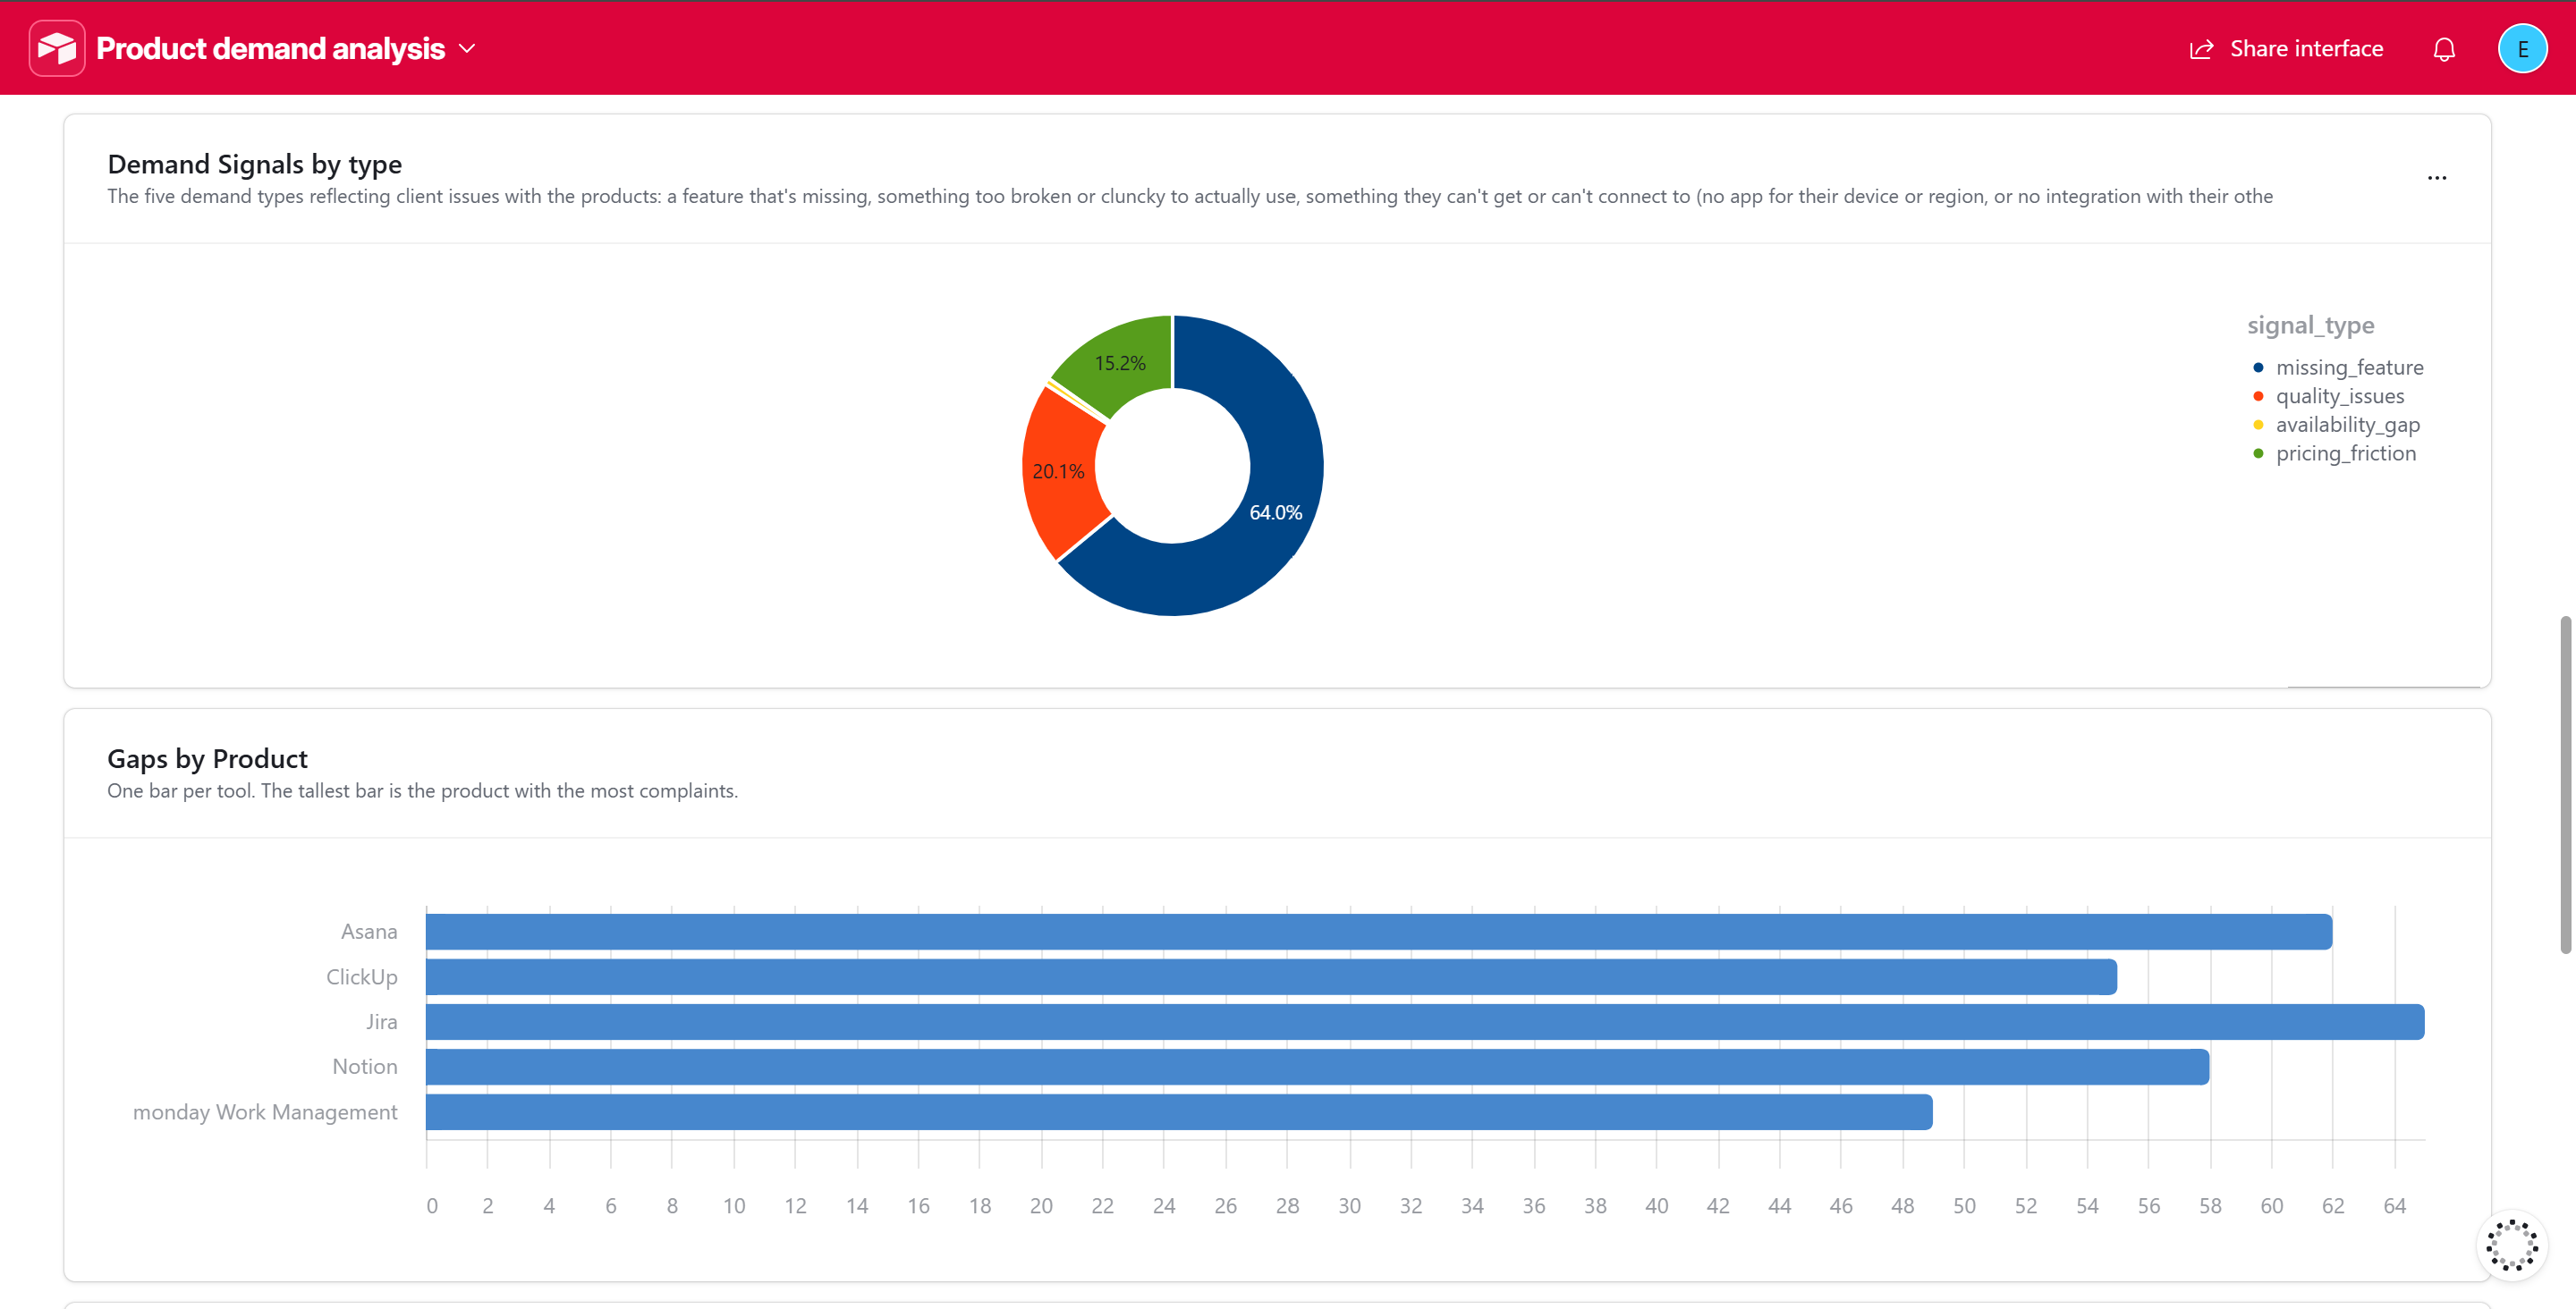
Chart 1: Demand signals by type
- Click + Add group on the canvas and choose Chart.
- Set Chart type to Donut.
- Set the field to group by to
signal_type. - Set the value to Count of records.
- Title it "Demand Signals by type." This shows your demand mix at a glance: missing features dominate at 64%, with quality issues and pricing friction next.
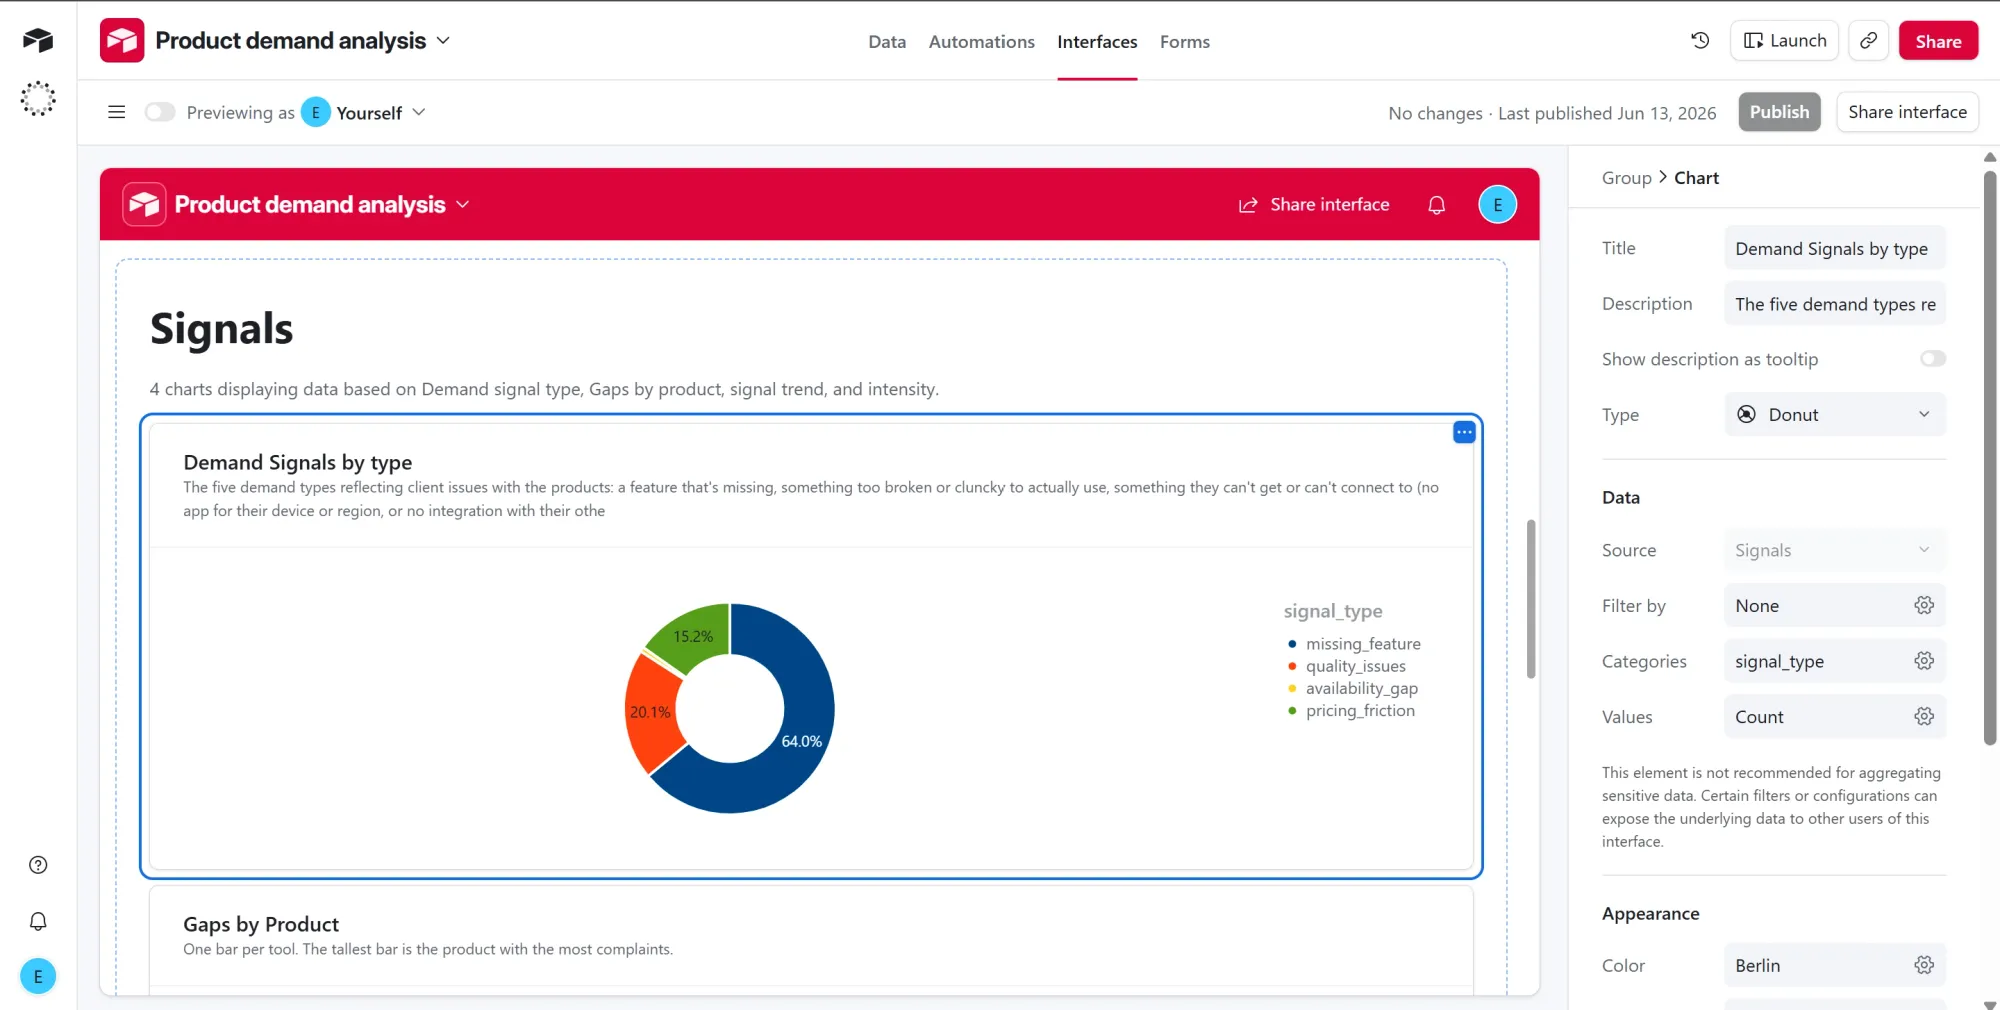
Chart 2: Gaps by product
- Click + Add group on the canvas and choose Chart.
- Set Chart type to Bar.
- Set the field to group by to
product. - Set the value to Count of records.
- Title it "Gaps by Product." One bar per tool, and the longest bar is the product drawing the most complaints, which is where the clearest opportunity sits.
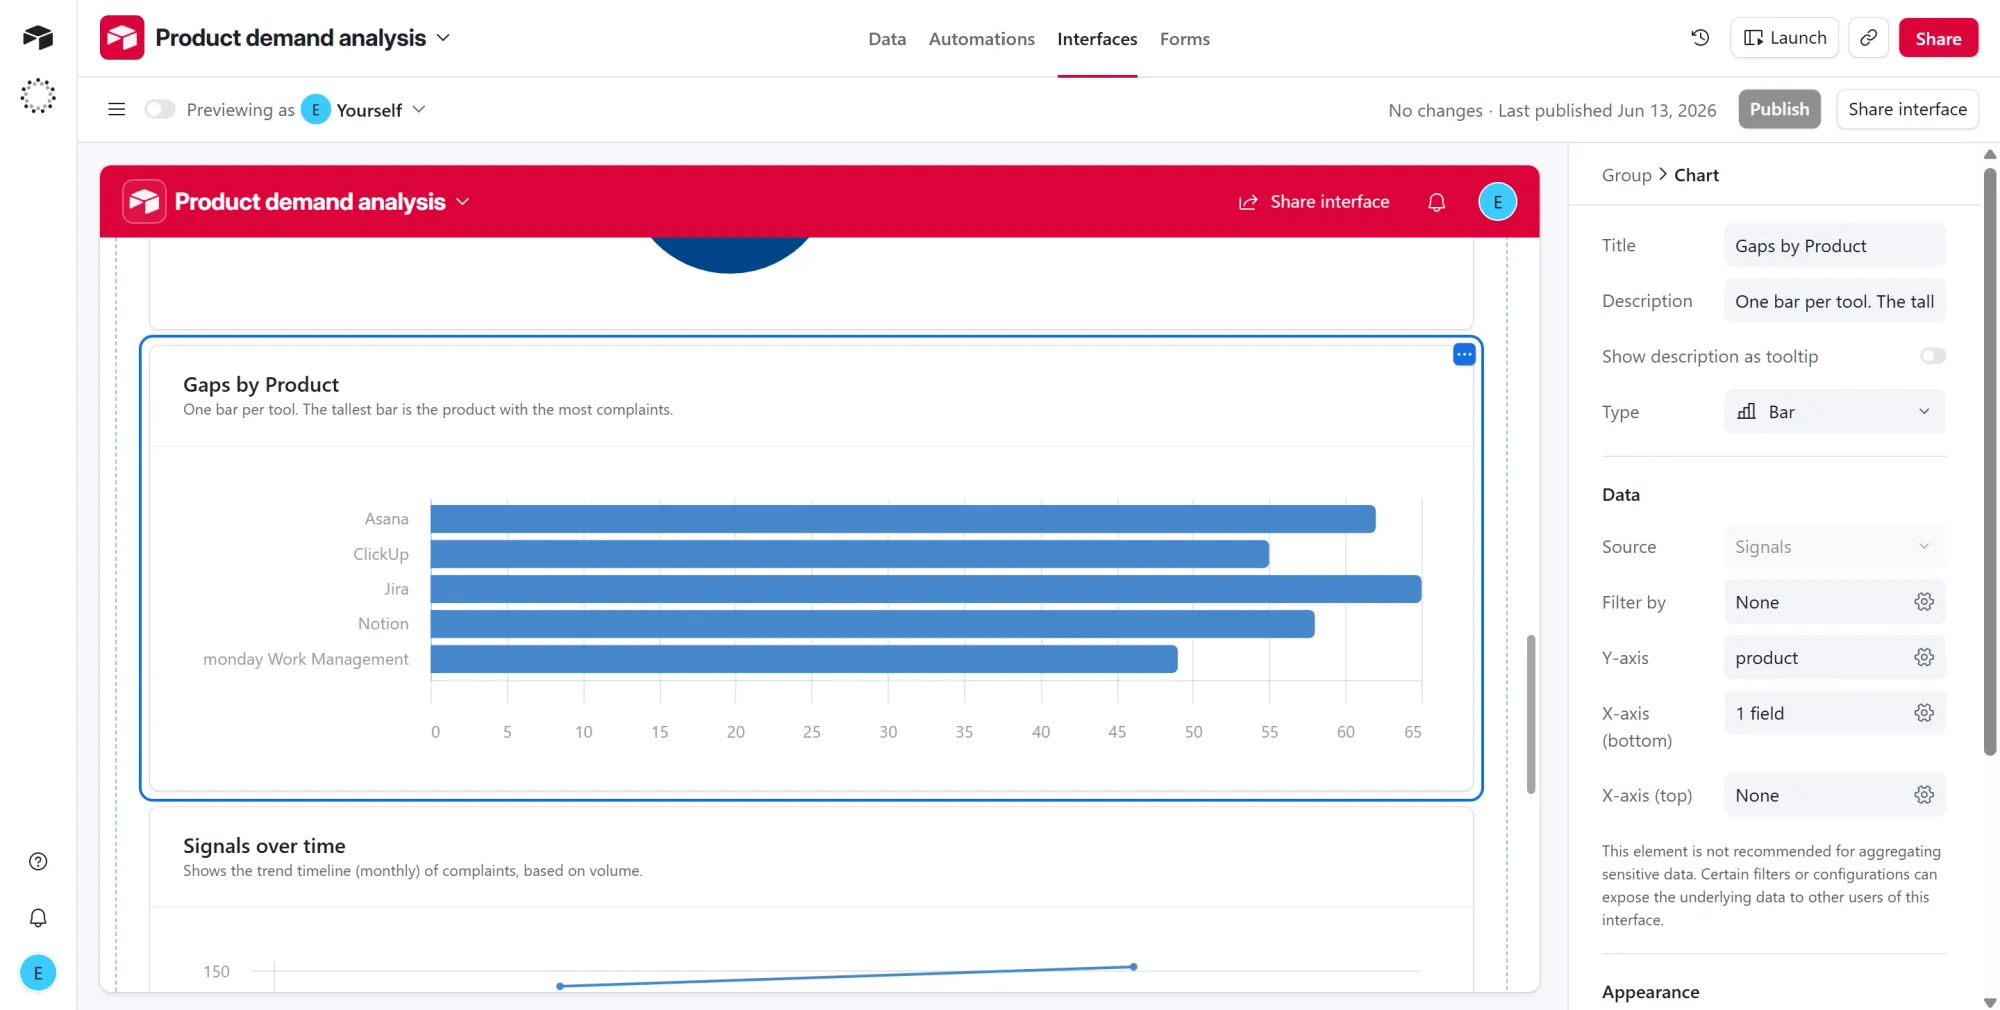
Chart 3: Signals over time
- Click + Add group on the canvas and choose Chart.
- Set Chart type to Line.
- Set the field to group by to
review_month. - Set the value to Count of records.
- Title it "Signals over time." This plots complaint volume by the month each review was posted, and because
review_monthis stored asYYYY-MMtext, the points line up in date order on their own.
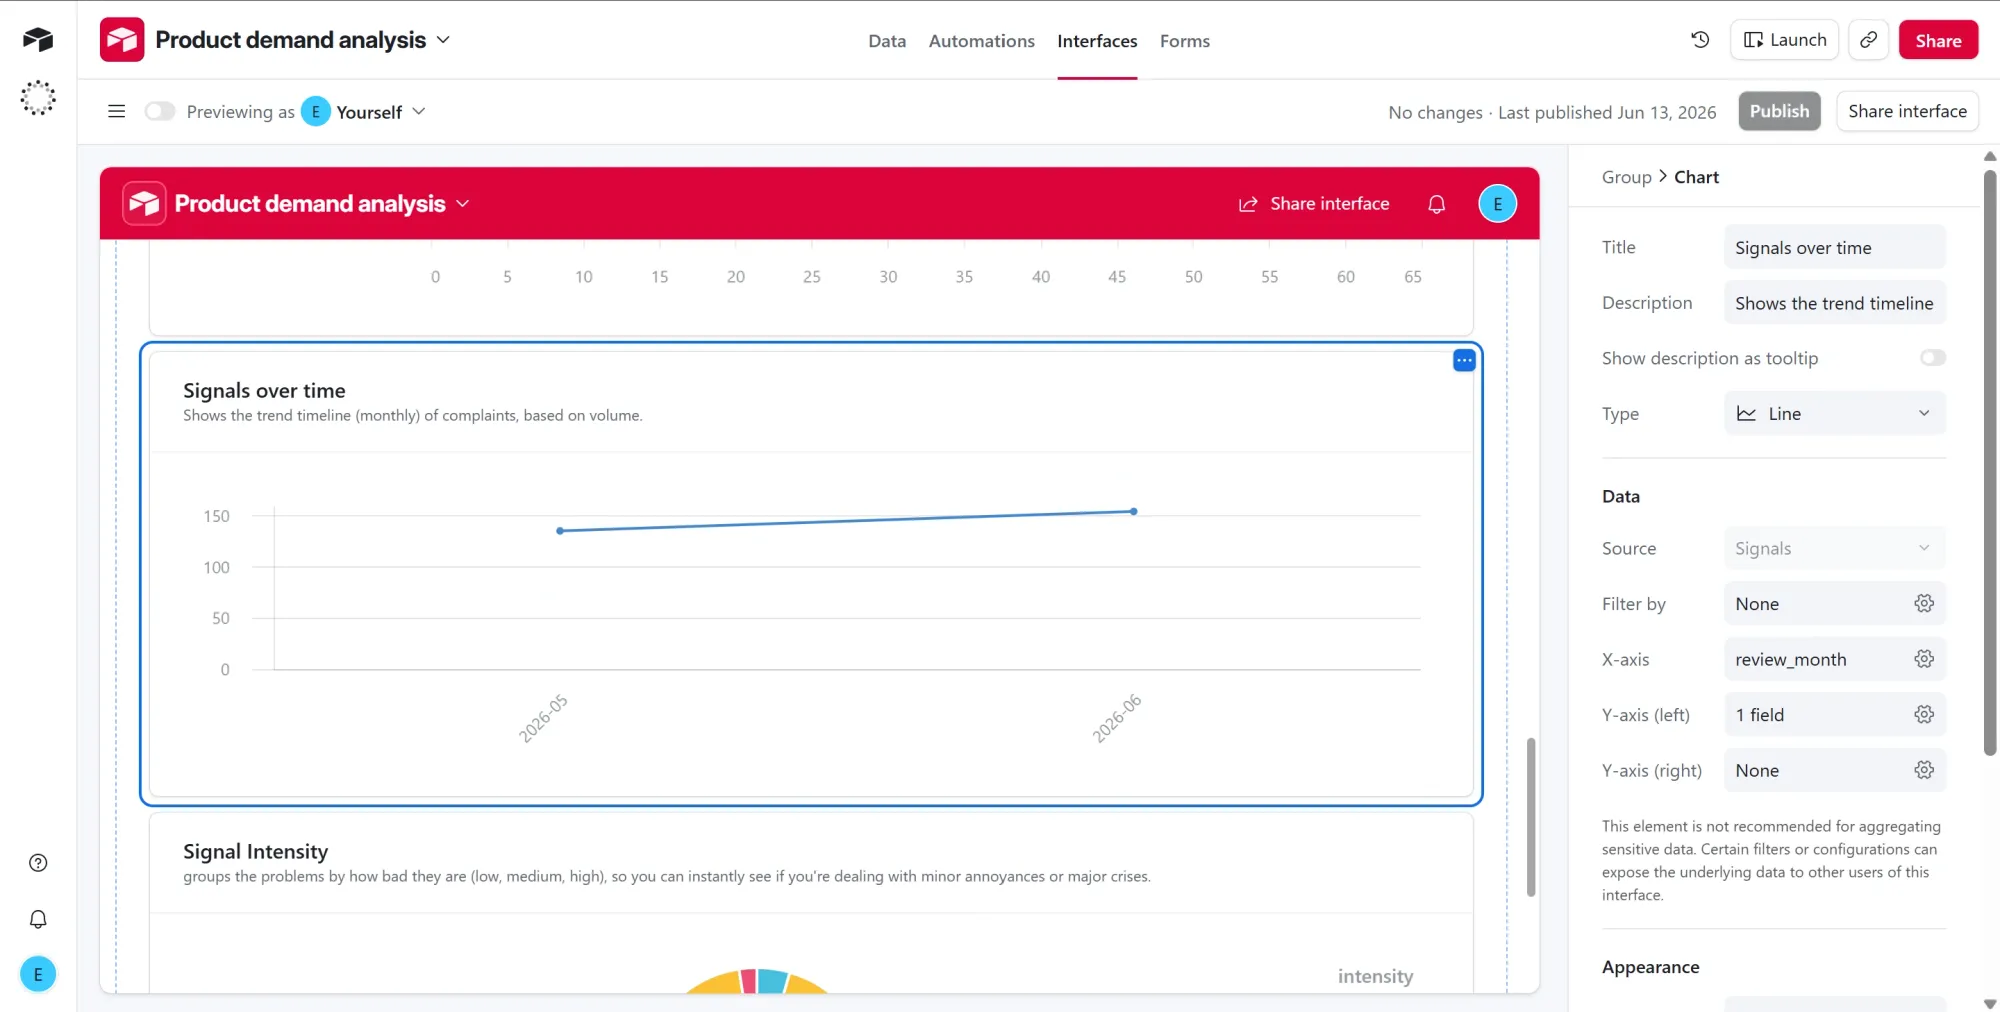
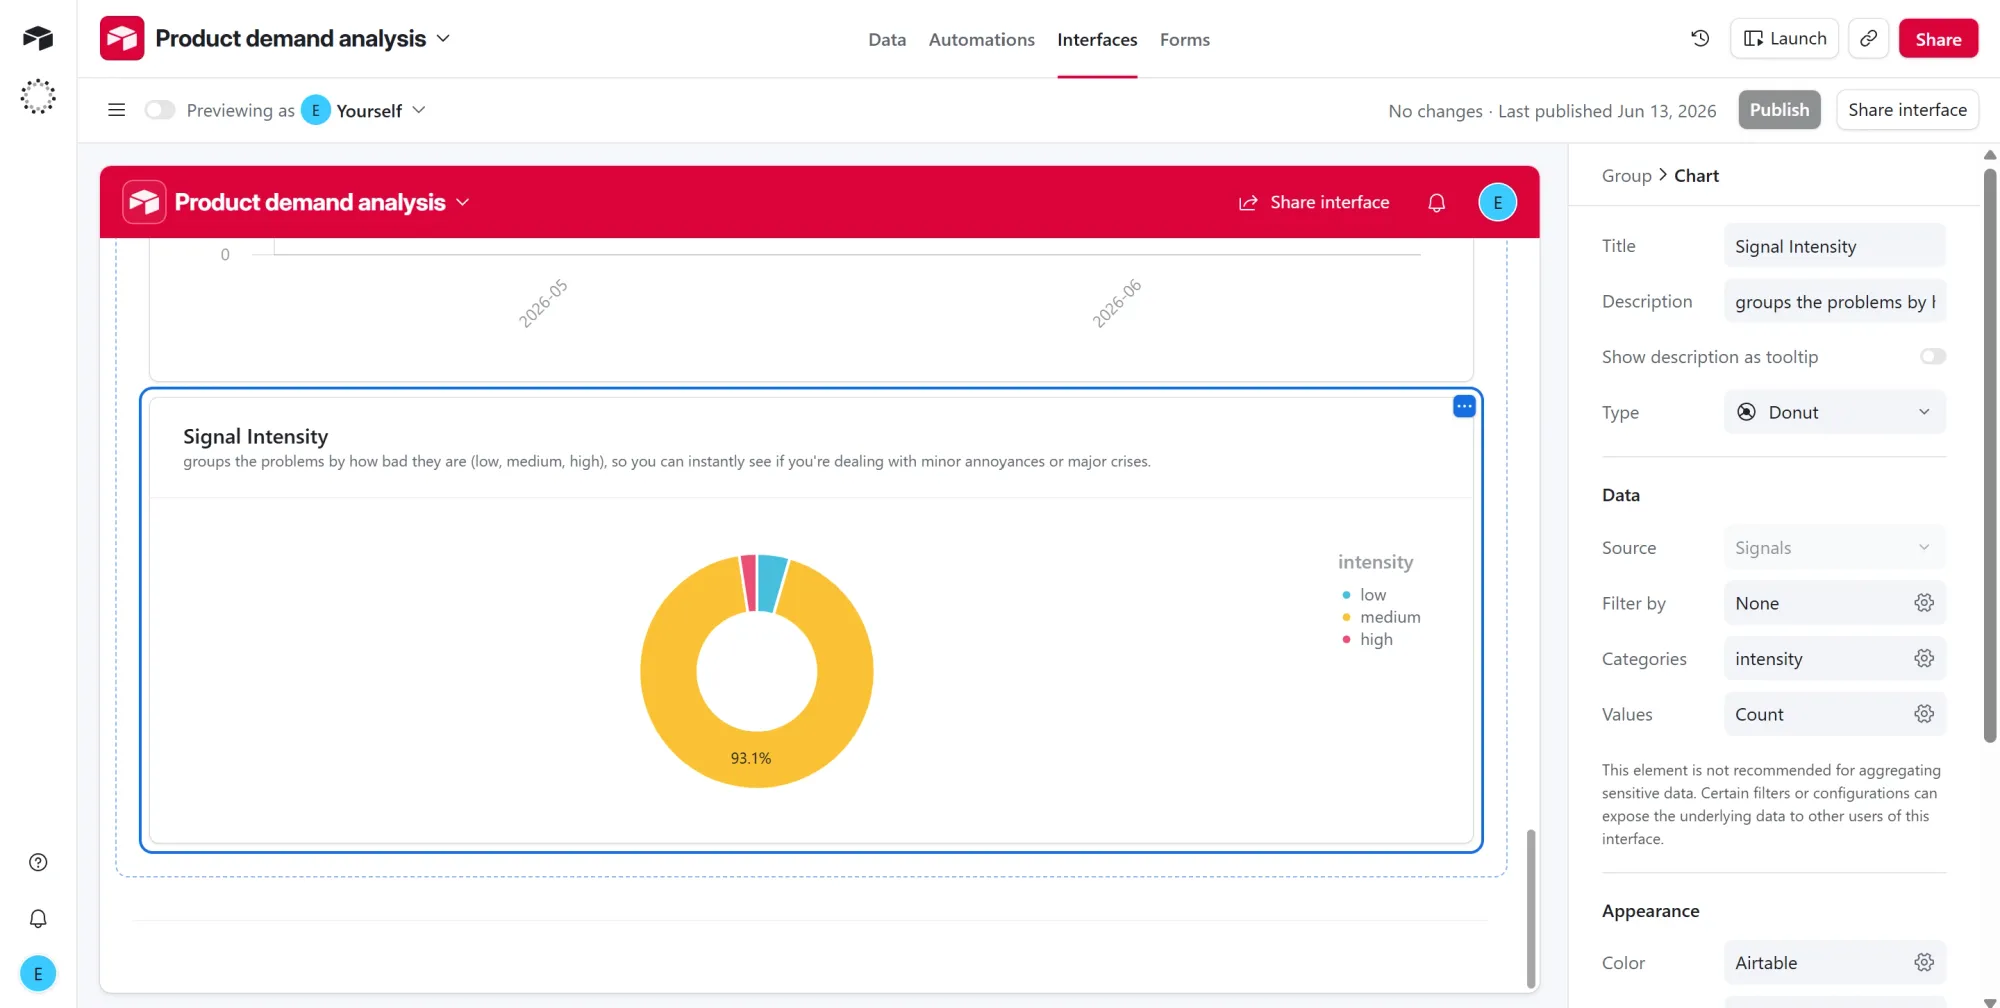
Chart 4: Signal intensity
- Click + Add group on the canvas and choose Chart.
- Set Chart type to Donut.
- Set the field to group by to
intensity. - Set the value to Count of records.
- Title it "Signal Intensity." This splits the signals into low, medium, and high so you can tell minor annoyances from major problems (medium dominates at 93% here).
Summary
Accurate product demand analysis requires rich web data. The problem is that most of this information is gated and painfully difficult to extract at scale. Apify removes that friction by unblocking access to even the strictest platforms.
The G2 Reviews & Products Scraper is just one of over 40,000 ready-made Actors in Apify Store. You can easily swap it out or join other Actors to pull signals from Capterra, Trustpilot, Reddit, or app stores.
This tutorial’s workflow runs completely on the Apify free tier. You get $5 in monthly platform credits and full access to the Store, with no credit card required.
Sign up for a free Apify account today, or bring your own ideas to life and monetize them on Apify, the largest marketplace for web data and AI tools.