
Machine learning models require vast amounts of data. Larger datasets lead to greater accuracy, resulting in better model performance.
Although the field of data science has evolved a lot during the last two decades, the challenges of data collection for AI remain. What are these challenges?
- Quality: Getting lots of data is one thing, but making sure it's accurate and relevant to the problem is a whole different thing.
- Diverse sources: Data comes from many different sources, like online platforms, sensors, and direct feedback. Each has its own format, which makes it difficult to handle.
- Time: Collecting meaningful data isn't always quick. It can be a lengthy process to gather just the right information, while the wrong information can skew results.
- Integration: Merging data from different sources can be like trying to blend oil and water. You need to be very careful to ensure consistency.
- Bias: Sometimes, the data you collect is biased and doesn't accurately represent the bigger picture, which is usually required for better results.
In this article
We'll cover all these problems and their solutions and find out how to generate better datasets for AI and machine learning models.
The aim will be a data pipeline with the following steps:
Ultimately, the data will be ready for any ML/DL model.
Getting started
To completely understand the content and code samples showcased in this post, you should have Python installed and the following libraries:
apify-clientimblearnmatplotlibnlpaugnltkpandassklearn
To install all these libraries in your environment, open your terminal and enter the following command:
pip install apify-client imblearn matplotlib pandas sklearnIt should be a quick install.
We'll also use an Apify API token in this tutorial. Here's how to get yours:
- Sign up or log in to your Apify account (free, no credit card needed)
- Navigate to the integrations section in the account settings
- Here, you'll find your unique API token. Keep it handy; you'll need it shortly!

How to collect data for machine learning
Step by step
Step 1. Data acquisition
The first step in the data collection phase is data acquisition, which means collecting the data from a source. The source can be a website, camera, sound recorder, or any other source of data relevant to your use case.
But extracting data from a source (scraping a website, for example) is a challenging task. The most time-consuming part is creating a scraper for that particular website. The Apify platform has this issue in hand. It provides hundreds of scrapers to fetch data from any website by following just a few steps.
In this tutorial, we'll use two Amazon review scrapers (Actors) from Apify Store. The reason for using two different scrapers is that we want to implement two data streams to better understand the concepts of the "data ingestion" part that follows.
Here's the code to scrape reviews of two different products from Amazon:
from apify_client import ApifyClient
import json
# Initialize the ApifyClient with API token
client = ApifyClient("apify_api_JaJdodNpT1eYrxklaWpG2gsL2N291O14MiAf")

# Prepare the first Actor input
first_run_input = {
    "url": "https://www.amazon.com/Apple-iPhone-11-64GB-White/dp/B08BHKSZ5P/ref=sr_1_1?keywords=iphone&qid=1692321184&sr=8-1&th=1"
}

# Prepare the second Actor input
second_run_input = {
    "productUrls": [
        {
            "url": "https://www.amazon.com/iPhone-Pro-1TB-Alpine-Green/dp/B0BGYCHZWF/ref=sr_1_1?crid=1KM34M1FH1SYO&keywords=iphone&qid=1692616691&sprefix=iphone%2Caps%2C384&sr=8-1&th=1"
        }
    ],
    "proxyConfiguration": { "useApifyProxy": True },
}
print("Scraping the data for the first product. You can see the running actors on Apify console")
# Run the first Actor and wait for it to finish
first_run = client.actor("bebity/amazon-reviews-scraper").call(run_input=first_run_input)
first_run_data = list(client.dataset(first_run["defaultDatasetId"]).iterate_items())
# Save the data in a Json file
with open('first_run.json', 'w') as f:
    json.dump(first_run_data, f)
print("\nFirst five entries from first_run:")
for _, entry in enumerate(first_run_data[:5]):
    print(entry)

print("\nScraping the data for the second product. You can see the running actors on Apify console")
# Run the second Actor and wait for it to finish
second_run = client.actor("junglee/amazon-reviews-scraper").call(run_input=second_run_input)
second_run_data = list(client.dataset(second_run["defaultDatasetId"]).iterate_items())
# Save the data in a Json file
with open('second_run.json', 'w') as f:
    json.dump(second_run_data, f)
print("\nFirst five entries from second_run:")
for _, entry in enumerate(second_run_data[:5]):
    print(entry)
In a nutshell, we're using the Apify client to scrape reviews for two different products.
- First, initialize the Apify client with an API token for authentication.
- Then set up the URLs as input.
- After that, trigger two separate
Actorsto collect their reviews and put the reviews injsonfiles. - Finally, print the scraped data. We'll use that data in the next step.
Step 2. Data ingestion for ML
Data ingestion is essentially the process of collecting and importing data from different sources, cleaning and structuring it, and then storing it for the next steps.
In this case, you have two data sources, and you may need to structure them to merge them and train the model.
#1. Using Pandas for data ingestion
The first thing to do is put the data in Pandas data frames. Let's do that now.
import pandas as pd

# Convert the first_run.json file into a dataframe
first_run_df = pd.read_json('first_run.json')

# Convert the second_run.json file into a dataframe
second_run_df = pd.read_json('second_run.json')

# To confirm, you can print the first few rows of each dataframe:
print(first_run_df.head())
print(second_run_df.head())
#2. Selecting columns
The next step is to select the columns that you need for the model and remove the remaining ones. Let's print the columns and see what we have:
print(second_run_df.columns)
print(first_run_df.columns)
The output would be something like this:
Index(['ratingScore', 'reviewTitle', 'reviewUrl', 'reviewReaction',
       'reviewedIn', 'date', 'country', 'countryCode', 'reviewDescription',
       'isVerified', 'variant', 'reviewImages', 'position', 'productAsin',
       'reviewCategoryUrl', 'totalCategoryRatings', 'totalCategoryReviews'],
      dtype='object')
Index(['reviewContent', 'title', 'date', 'clientName', 'notation',
       'profilePicture', 'commentImages', 'commentLink'],
      dtype='object')
Let’s go with the following columns:
reviewContentorreviewDescriptionratingScoreornotationreviewTitleortitlereviewUrlorcommentLinkdate
Now let's remove the remaining columns from both data frames.
# For the first_run DataFrame
first_run_df = first_run_df[['reviewContent', 'title', 'date','notation']]
# For the second_run DataFrame
second_run_df = second_run_df[['reviewDescription', 'ratingScore', 'reviewTitle', 'date']]
#3. Finding and filling missing values
The next step is to find missing values from the columns and fill them.
# Check for null values in both datasets
null_values_dataset_1 = first_run_df.isnull().sum()
null_values_dataset_2 = second_run_df.isnull().sum()

# Identify columns with null values
columns_with_null_values_1 = null_values_dataset_1[null_values_dataset_1 > 0]
columns_with_null_values_2 = null_values_dataset_2[null_values_dataset_2 > 0]
print(columns_with_null_values_1)
print(columns_with_null_values_2)
You can see some columns with missing values here. We'll drop those entries and generate new data from the remaining dataset in the next steps.
# Drop rows with any NULL values for the first_run DataFrame
first_run_df = first_run_df.dropna()
# Drop rows with any NULL values for the second_run DataFrame
second_run_df = second_run_df.dropna()
This code will drop all the rows with missing values.
#4. Making the data types and values consistent
The next step is to make the data types and values from the data sources consistent. In this case, if you look at the data column in both data frames, the format and the values of the columns differ. Let's make them consistent.
# Format the date in the first dataframe
first_run_df['date'] = first_run_df['date'].str.extract(r'on (\w+ \d+, \d+)')
first_run_df['date'] = pd.to_datetime(first_run_df['date'], format='%B %d, %Y')
# Format the date in the second dataframe
second_run_df['date'] = pd.to_datetime(second_run_df['date'], format='%Y-%m-%d')
first_run_df.head(), second_run_df.head()
The last step in this pipeline is to make the column names consistent in both data frames and merge them.
# Rename the columns in first dataframe for consistency
first_run_df.rename(columns={
    'reviewContent': 'reviewDescription',
    'title': 'reviewTitle',
    'notation': 'ratingScore'
}, inplace=True)
# Merge the two dataframes
merged_df = pd.concat([first_run_df, second_run_df], ignore_index=True)
merged_df.head()
The refined data is now ready to be saved in any database. It could be an SQL database or any other tool. In this case, we'll save the data in a csv file.
# Name the file
file_name = "merged_reviews.csv"
# Save the file as csv
merged_df.to_csv(file_name, index=False)
Step 3. Data augmentation
Data augmentation is the process of generating new synthetic data from the current data if the current data has fewer samples. Augmentation methods are very popular in computer vision applications but are just as powerful for natural language processing. In computer vision, you just flip the images to generate a new data entry, but in NLP, you change the text by applying different methods. One of them is synonym replacement.
For this method, replace the synonyms of the current text to generate a new text with the same meaning. It's a very delicate technique because just one wrong synonym or word can change the whole context of the text. For this, we'll use nlpaug , a very powerful library that replaces synonyms.
pip install nlpaugAfter this, you can use the wordnet library to help with synonyms.
import nlpaug.augmenter.word as naw
# Initialize the SynonymAug augmenter. "n" represents the number of synonyms in each sentence
description_aug = naw.SynonymAug(aug_src='wordnet', aug_max=5)
# define a new list to store the augmented rows
new_rows = []

# Loop through each row of the dataset
for _, row in merged_df.iterrows():
    # Augment the reviewDescription columns. "n" denotes the number of sentences we want to augment
    augmented_description = description_aug.augment(row['reviewDescription'], n=1)

    # Create a new row with the augmented data and other columns unchanged
    new_row = row.copy()
    if len(augmented_description) != 0:
        new_row['reviewDescription'] = augmented_description[0]
    new_rows.append(new_row)

# Convert list of new rows to a DataFrame
new_rows_df = pd.DataFrame(new_rows)

# Append the new rows DataFrame
merged_df_augmented = pd.concat([merged_df, new_rows_df], ignore_index=True)
The code above uses the nlpaug library to augment the reviewDescription column with synonyms from wordnet and generate a new version of each description. It then appends the augmented descriptions.
Step 4. Data preprocessing
The preprocessing stage involves transforming raw textual data into a structured and clean format that can be easily fed into machine learning or deep learning models. This phase is crucial because, as the saying goes, "garbage in, garbage out." If the data is not cleaned enough, the model will eventually give bad results.
To clean the data, you need to go through several steps:
- Lower casing
- Removing punctuation
- Tokenization
- Removing stopwords
- Lemmatization
We'll do all this using nltk. If you don't have it installed in your environment, you can install it using the following command:
pip install nltkNow, pass reviewDescription through all these steps:
import nltk
from nltk.corpus import stopwords
from nltk.stem import WordNetLemmatizer
from nltk.tokenize import word_tokenize
import re
# Download necessary NLTK data
nltk.download('punkt')
nltk.download('wordnet')
nltk.download('stopwords')
# Initialize the lemmatizer
lemmatizer = WordNetLemmatizer()
# Set the stop words
stop_words = set(stopwords.words('english'))
# Perform preprocessing methods to each row
def preprocess_text(text):
    # Convert to lowercase
    text = text.lower()
    # Remove punctuation
    text = re.sub(r'[^\w\s]', '', text)
    # Tokenization
    tokens = word_tokenize(text)
    # Remove stopwords and lemmatization
    tokens = [lemmatizer.lemmatize(token) for token in tokens if token not in stop_words]
    return ' '.join(tokens)

# Apply preprocessing to reviewDescription columns
merged_df['reviewDescription'] = merged_df['reviewDescription'].apply(preprocess_text)
In this code, we used the Natural Language Toolkit (NLTK) to clean the text. We did the following:
- Changed the text to lowercase.
- Removed punctuation.
- Broke it into individual words as tokens.
- Removed common stopwords like "and" or "the" and simplified each word to its root form.
- Transformed the tokenized words back into sentences.
What if the data contains imbalanced classes?
After all that hassle, you don't want to have imbalanced data classes, do you? Imbalanced classes may contain 90 samples of 1 class and just 10 samples of the other. In this case, the model will be biased towards the first class, no matter how well-designed it is.
It's very important to have a balanced dataset for an unbiased and optimized model performance. To achieve this, you need to implement methods that generate the data points of the minority class, ensuring the dataset is better suited for the model.
Step 5. Generating a dataset for ML
In the end, it's very important to have a complete overview of the dataset. If the data is biased, you need to try to make it unbiased to improve the model's performance. Let's take a look at the distribution of the classes for the target column that is ratingScore.
import matplotlib.pyplot as plt
# Count the number of samples for each class in ratingScore column
rating_counts = merged_df['ratingScore'].value_counts()
# Plot
plt.figure(figsize=(8, 6))
rating_counts.plot(kind='bar', color='skyblue')
# Set the title of the plot
plt.title('Class distribution for ratingScore')
# Set the x and y labels
plt.xlabel('Rating Score')
plt.ylabel('Number of Reviews')
plt.xticks(rotation=0)
plt.grid(axis='y')
plt.tight_layout()
plt.show()
The resulting graph of this example would look a little bit like this:
This means you have an unequal distribution of classes in the dataset, and you need to increase the data points or data samples of the minority classes. For this, you'll use the Synthetic Minority Oversampling Technique (SMOTE). This technique generates synthetic samples of the minority classes and tries to balance the class distribution.
Before applying SMOTE, you need to first perform two steps:
- Vectorization: Convert text into a numerical format so the model can understand and process it.
- Train-Test Split: Separate the data to ensure the model learns from one portion and gets tested on an unseen portion, keeping the evaluation genuine.
# Import the necessary libraries
from sklearn.feature_extraction.text import TfidfVectorizer
from sklearn.model_selection import train_test_split
# Define the features
tfidf_vectorizer_description = TfidfVectorizer(max_features=5000)
# Transform reviews to vesctors
X_description = tfidf_vectorizer_description.fit_transform(merged_df['reviewDescription'])
# Set the target column
y = merged_df['ratingScore']
# Apply train and test split
X_description_train, X_description_test, y_description_train, y_description_test = train_test_split(X_description, y, test_size=0.2, random_state=42)
The above code divides the data into train and test splits with a proportion of 80% training and 20% test.
Now, we're ready to apply SMOTE on the training data.
from imblearn.over_sampling import SMOTE
smote = SMOTE(random_state=42,k_neighbors=4)
X_description_train_resampled, y_description_train_resampled = smote.fit_resample(X_description_train, y_description_train)
The code above will generate synthetic samples for the minority classes and make an equal distribution if you try to make the same plot again.
description_counts_train = y_description_train_resampled.value_counts()
# Plotting
plt.figure(figsize=(8, 6))
description_counts_train.plot(kind='bar', color='skyblue')
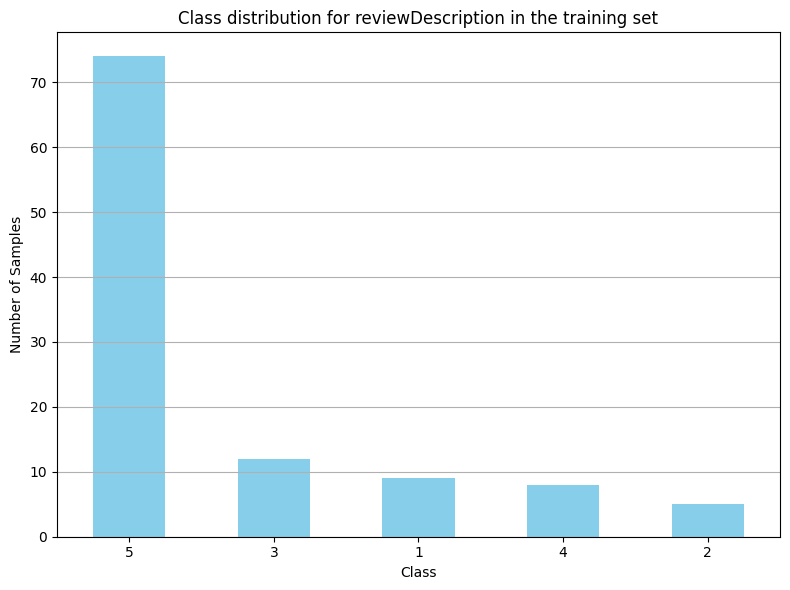
plt.title('Class distribution for reviewDescription in the training set')
plt.xlabel('Class')
plt.ylabel('Number of Samples')
plt.xticks(rotation=0)
plt.grid(axis='y')
plt.tight_layout()
plt.show()You'll see a graph like this:
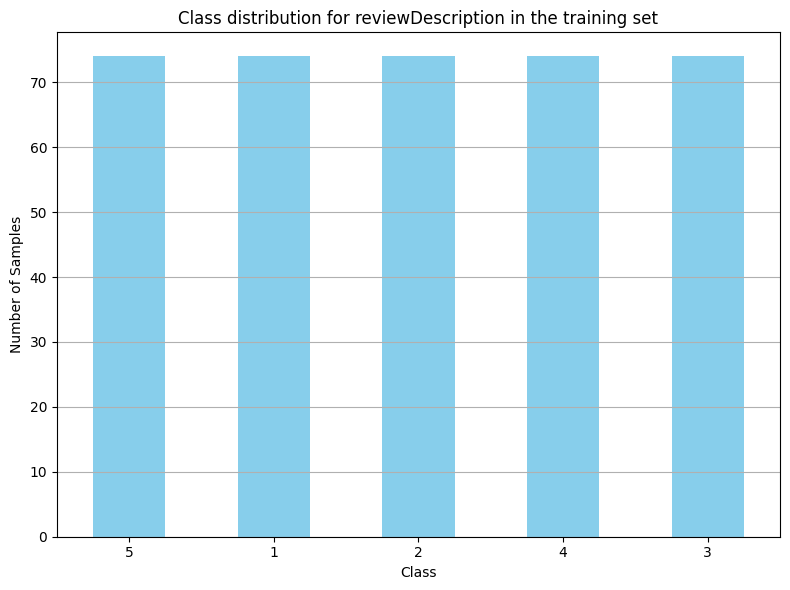
This equal distribution will help the model to generalize the concepts. After this step, the data is ready to be fed to the machine learning model, which will almost certainly perform better.
An ML model is only as good as the data
We've covered almost the entire pipeline for data collection for machine learning, from acquiring data to generating new samples before training a model.
We learned about removing irrelevant data and only retaining what's necessary and discovered the importance of equal representation of all classes in our training sample.
This shows how important data quality is in machine learning, deep learning, and AI in general. The models are, of course, important, but perhaps the data fed to them is even more crucial.