
A restaurant chain can post solid brand-level numbers while individual locations are bleeding orders. A store whose delivery zone is filled with cheaper competitors gets masked by stronger sites elsewhere, and by the time monthly reports flag the dip, the platform is already routing customers somewhere else.
Manual spot checks don’t scale past three or four locations. What you need is automated, zone-level visibility into how each store stacks up against the actual competitors a customer sees when they open DoorDash or Instacart in that ZIP code.
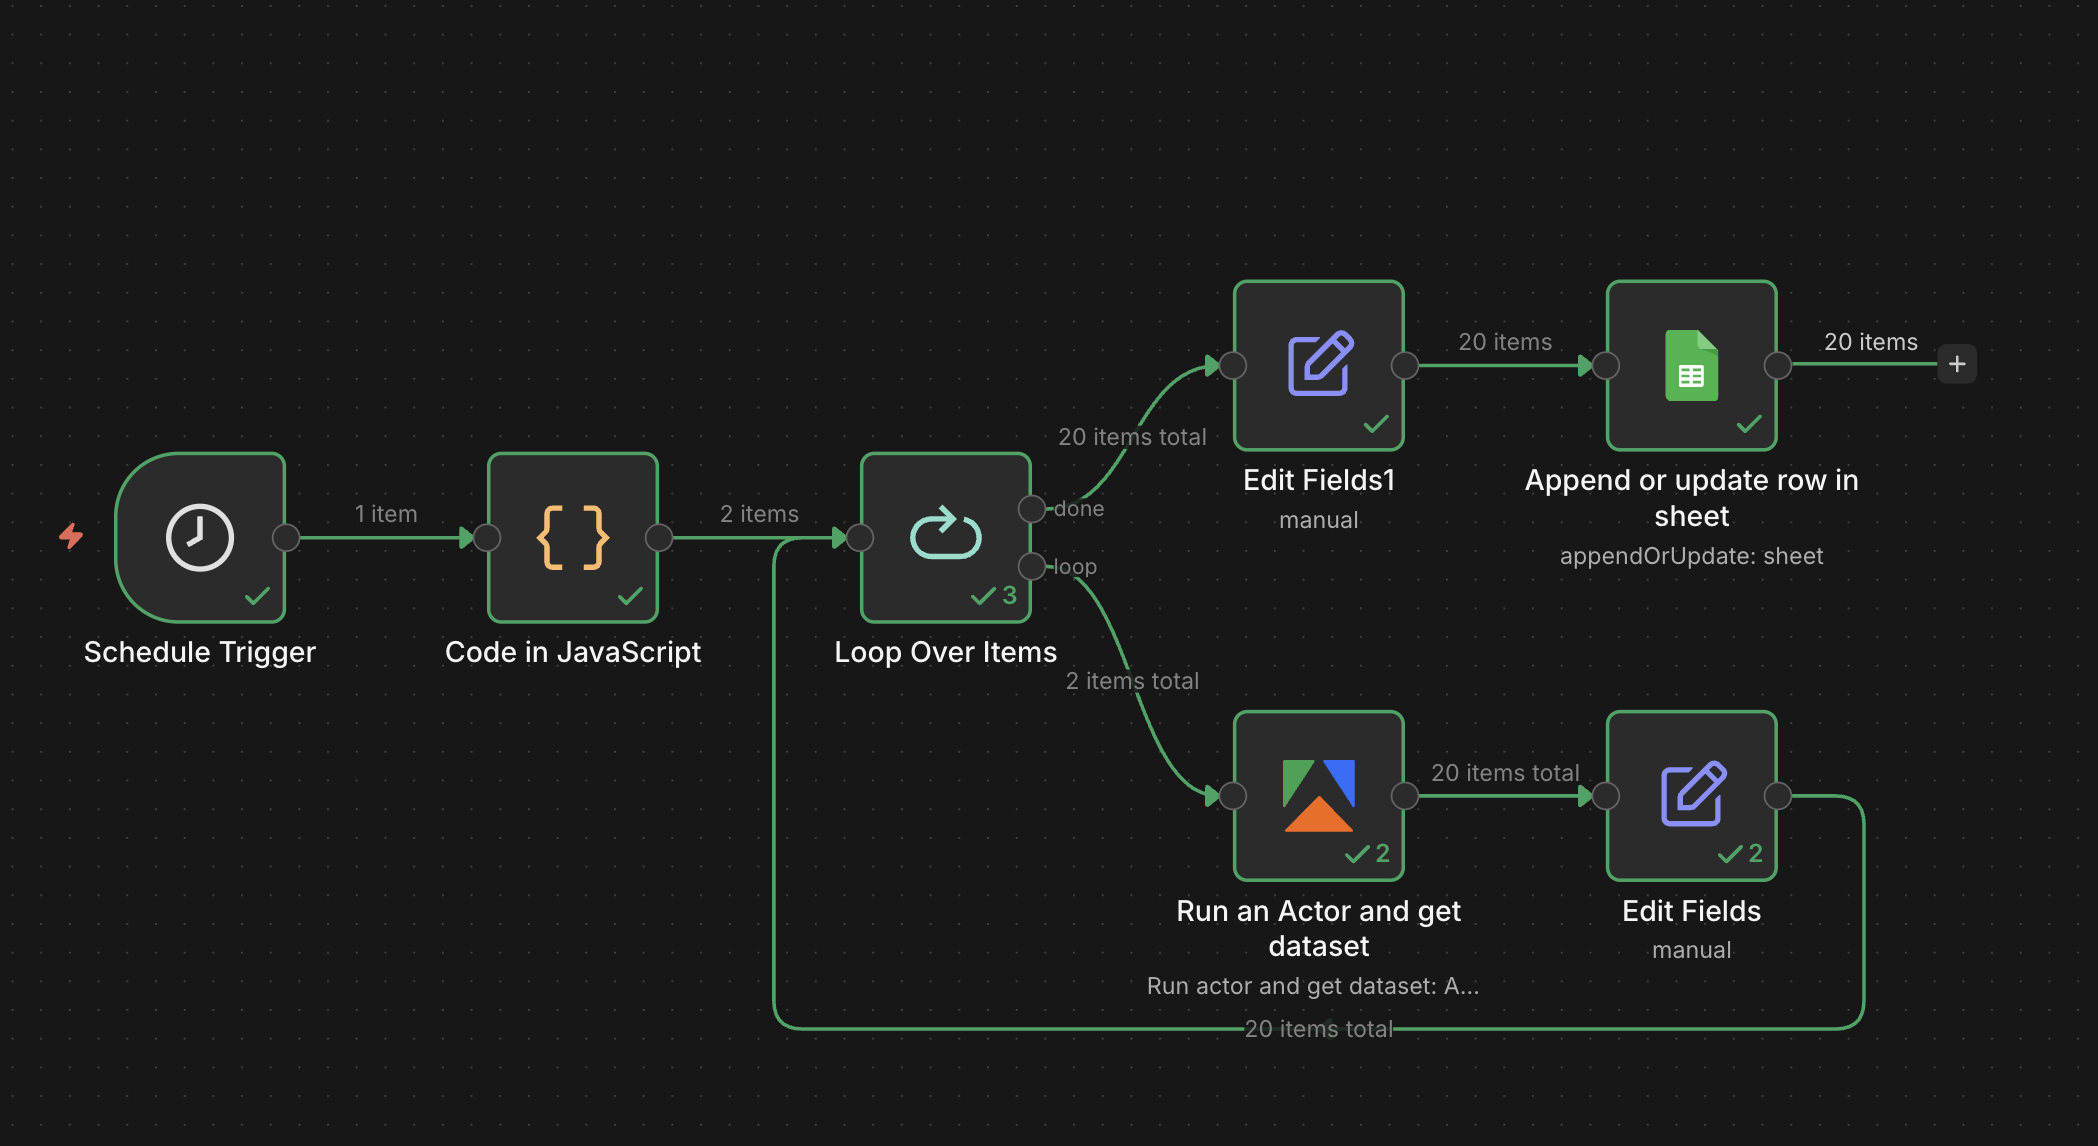
This tutorial walks through how to set that up using E-commerce Scraping Tool with n8n - pulling competitor listings alongside your own pages from DoorDash and Instacart, on a schedule, with structured output that drops straight into Google Sheets.
Why brand-level delivery data isn't enough
Brand-wide averages warp location-level performance. A struggling store gets hidden by stronger sites, and the decline doesn’t surface in dashboards until orders have already shifted to competitors.
Each location also operates in a different competitive set. Pricing that looks competitive in one city can be much higher than the local norms in another.
The data needed to fix this exists on DoorDash and Instacart, but it’s unstructured, scattered across platforms, and impossible to aggregate at scale without automation.
How E-commerce Scraping Tool solves this
E-commerce Scraping Tool is an Apify Actor that can pull product and pricing data from delivery platforms by location or ZIP code. Configure it with a location and a search keyword, and it returns a structured dataset of competitor listings. Schedule it to run daily, weekly, or monthly, and the result is a continuously updated, zone-level view of the market each of your locations is competing in.
Setting up zone-level monitoring with Apify
By the end of this tutorial, you’ll have a running workflow that pulls competitor prices for every zone you care about and writes them into a single sheet, tagged by location and ready for comparison.
Let’s begin.
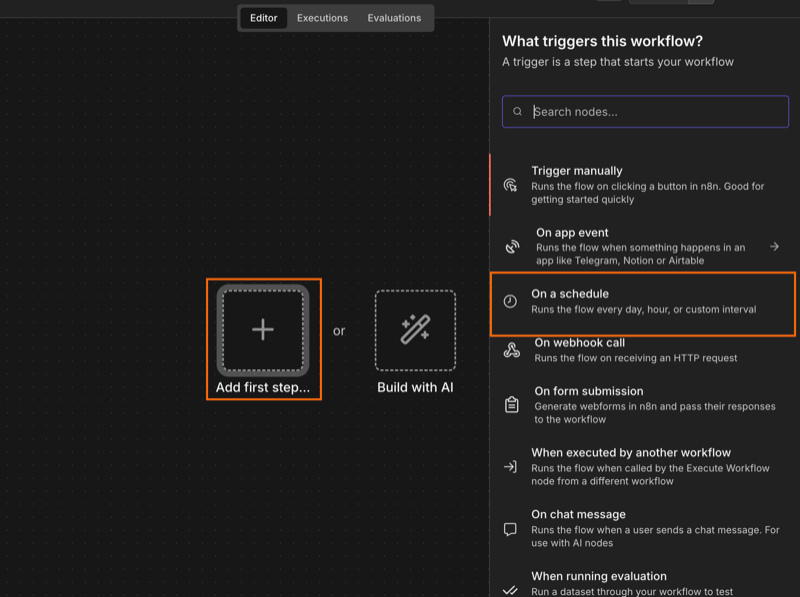
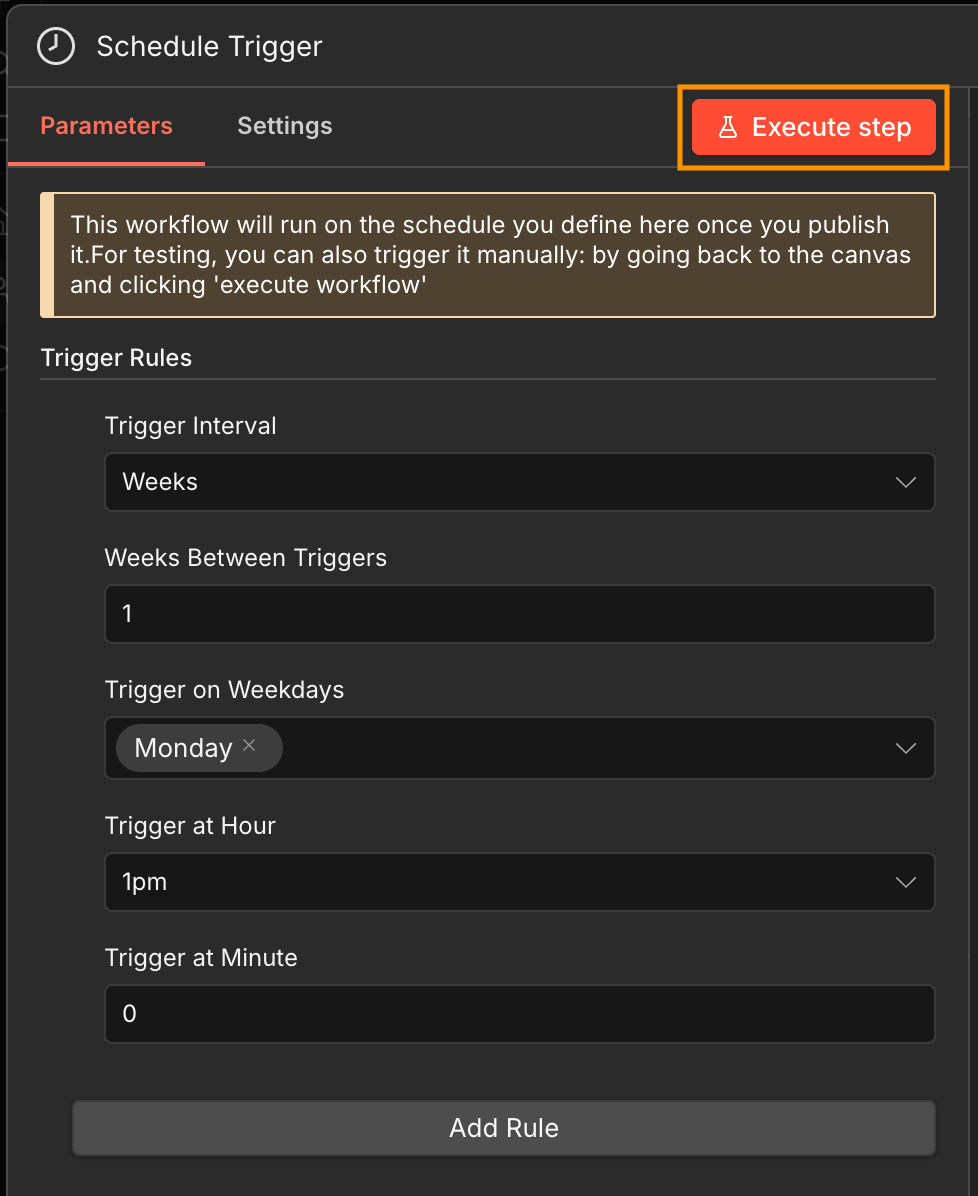
Step 1: set up the scheduled trigger
Open n8n, create a new workflow, and select a scheduled trigger as the first step. You can then set how often the workflow runs in the Trigger Rules.
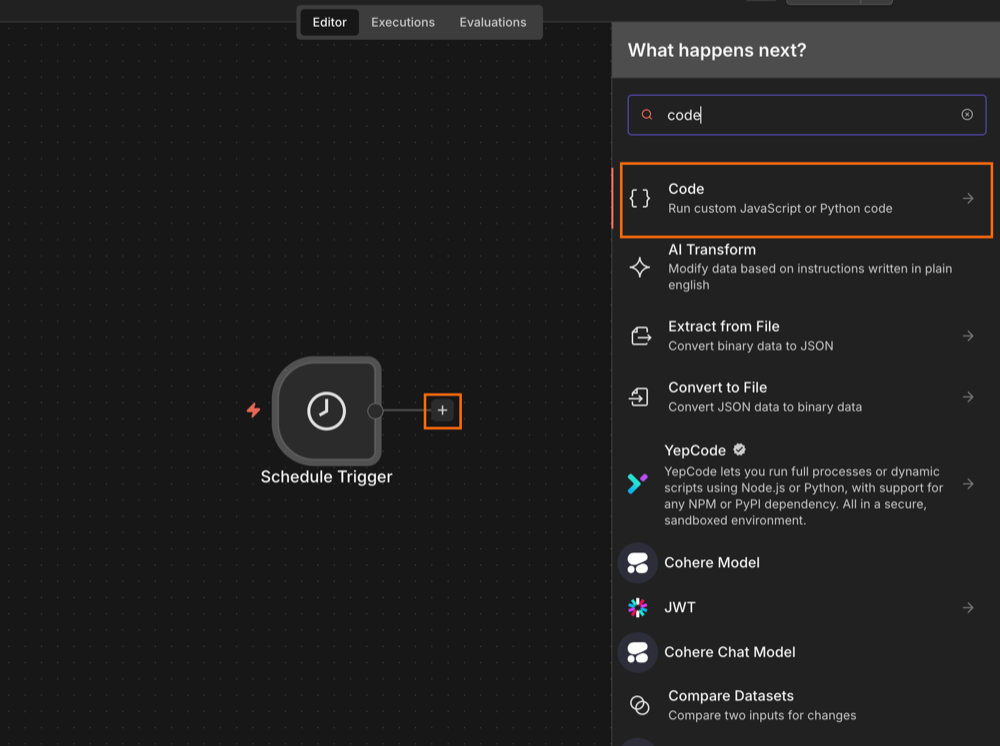
Step 2: initialize the workflow input
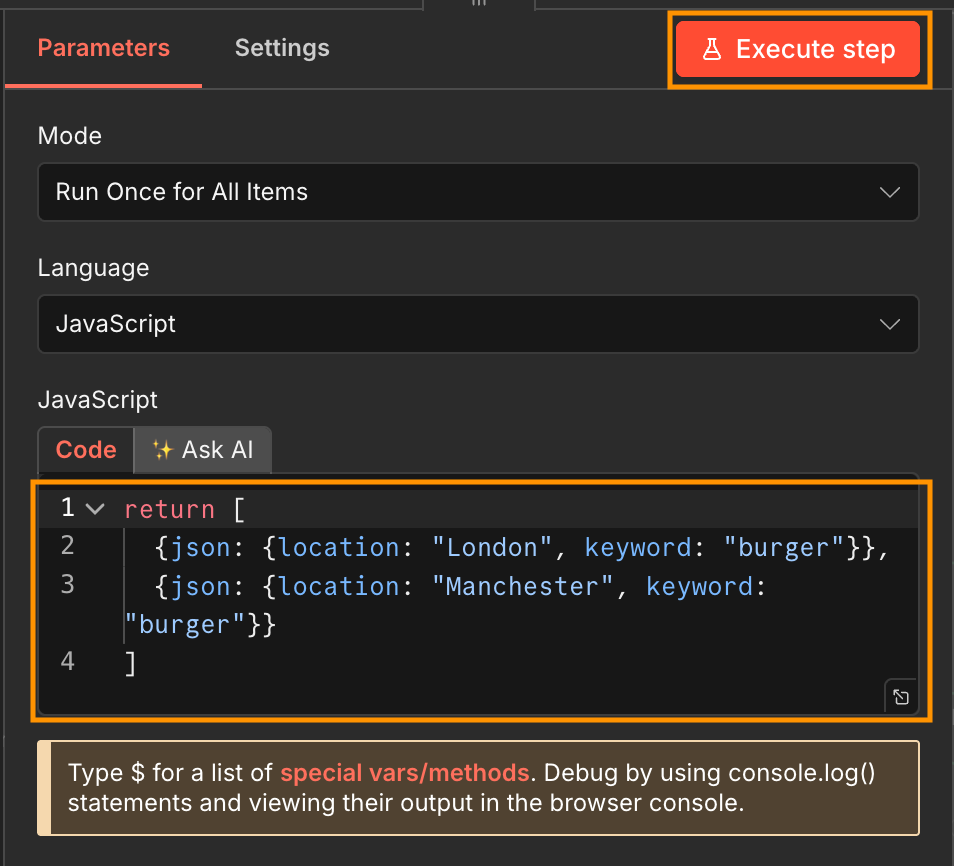
To run the Actor on a loop, the input variables need to be an array of JSON objects. Each JSON needs to include both the search keyword, and the location/zip code. To limit credit usage, stick with two locations while testing - you can scale up later.
Create a JavaScript Code node and add you input in the following format. Then execute the step.
return [
  {json: {location: "London", keyword: "burger"}},
  {json: {location: "Manchester", keyword: "burger"}}
]
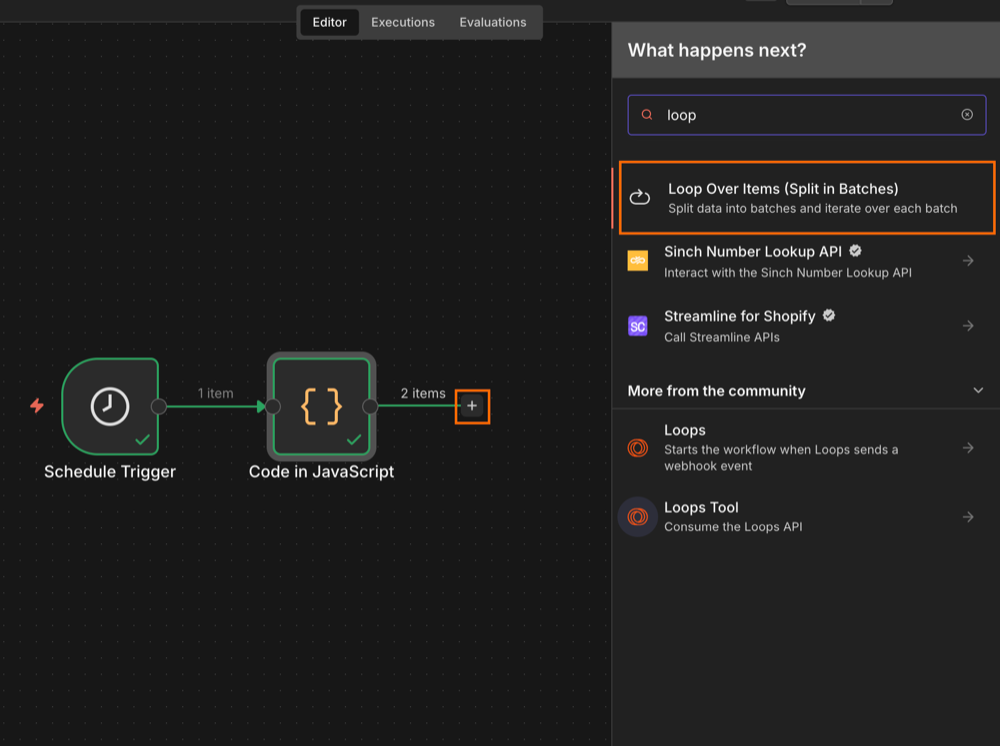
Step 3: create a loop to process locations
Next, create a loop so the Actor can scrape locations one at a time. Select the Loop Over Items (Split in Batches) operation as the next workflow step. Keep the batch size as one.
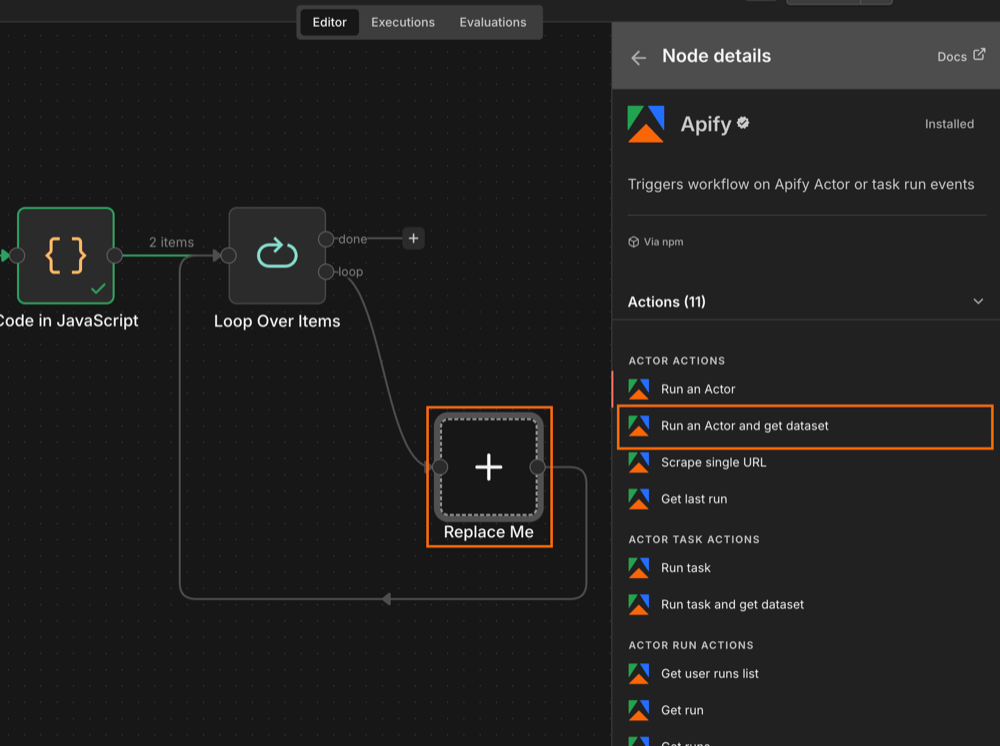
Step 4: connect your Apify account and select the Actor
Search for the Apify node in your canvas and install it (if you haven't already). Replace the placeholder node with the Run an Actor and get dataset operation.
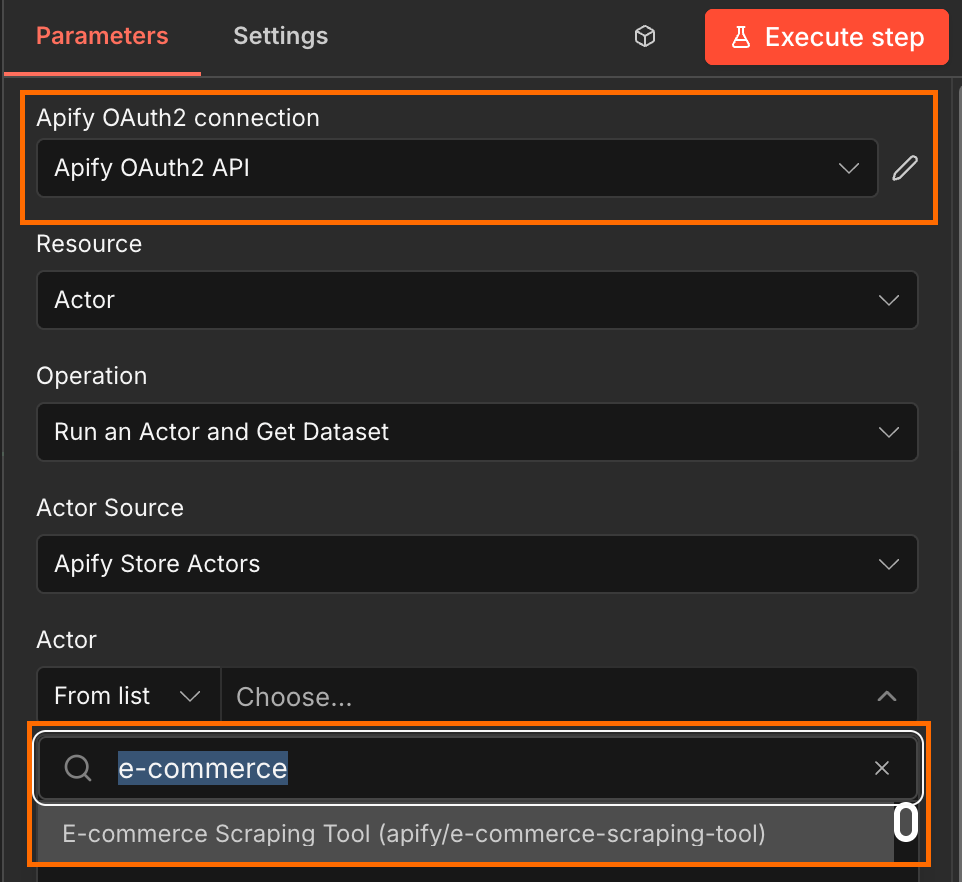
Next, connect n8n to your Apify account. This can be done using OAuth2, or by pasting your Apify API key located in Apify Console under Settings → API & Integrations. Once your Apify connection is established, select Apify’s E-commerce Scraping Tool from the Actor list.
Step 5: configure the Actor's input
Initialize the Actor's input and map the location and keyword to the correct fields. The safest option is to paste the JSON below into the Input JSON field, and toggle from Fixed to Expression.
{
    "additionalProperties": false,
    "additionalPropertiesSearchEngine": true,
    "additionalReviewProperties": true,
    "addressDelivery": "{{ $json.location }}",
    "keywordDelivery": "{{ $json.keyword }}",
    "marketplacesDelivery": [
        "www.instacart.com",
        "www.doordash.com"
    ],
    "maxDeliveryResults": 10,
    "maxProductResults": 10,
    "scrapeInfluencerProducts": false,
    "scrapeReviewsDelivery": false
}
Since the Actor expects strings rather than n8n's default object passthrough, make sure that {{ $json.location }} and {{ $json.keyword }} are wrapped in quotation marks.
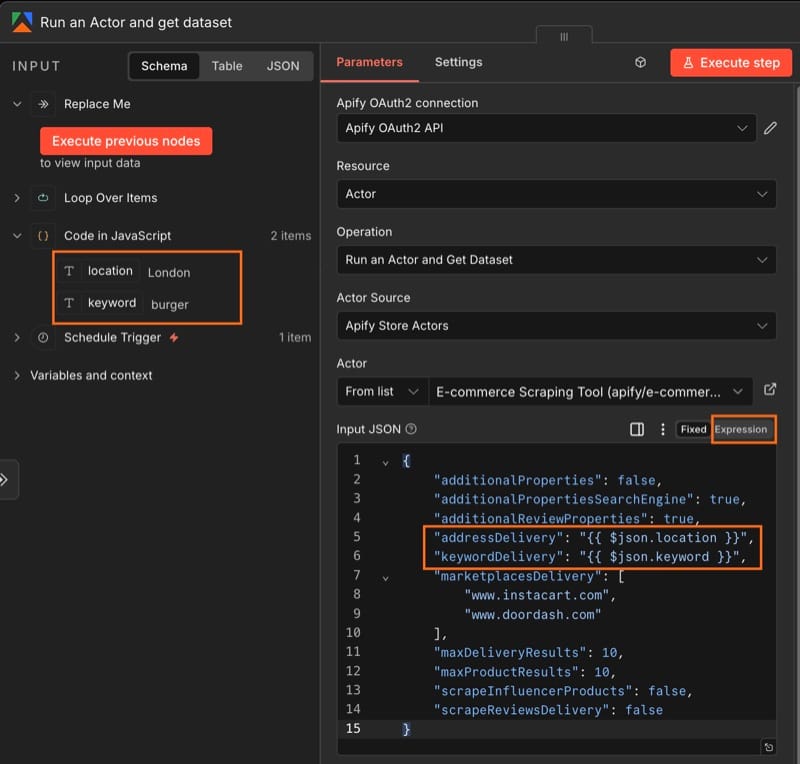
Run this step once so that n8n captures the Actor's output schema - later steps need to know what fields are coming back.
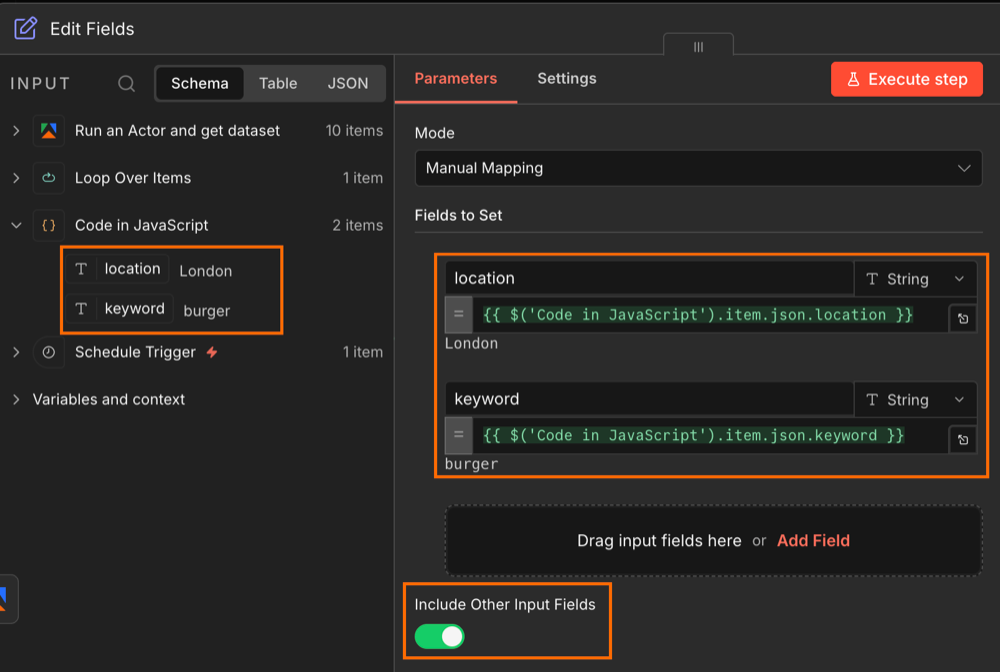
Step 6: reattach the location and keyword tags
When the loop runs the Actor, the original location and keyword get separated from the Actor's output. This Set node stitches them back together so each row in the final sheet is tagged with the location it came from.
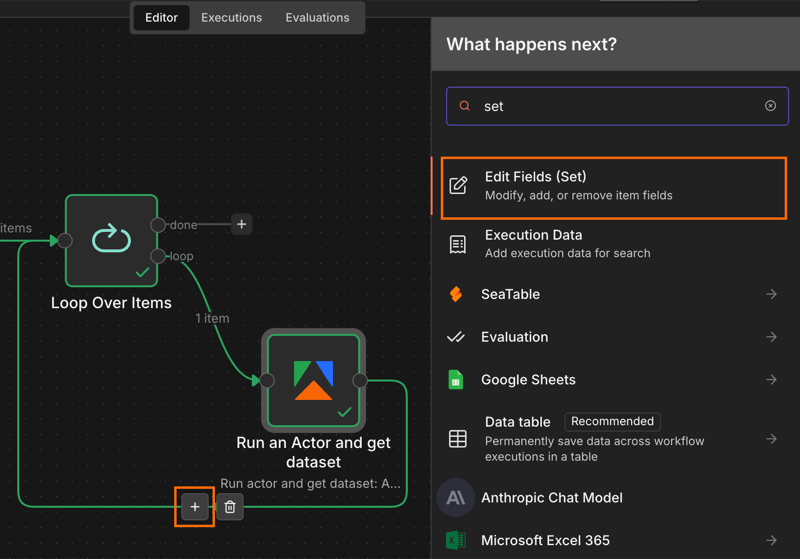
Drag and drop the location and keyword items from the initial Code node into the input fields box. Make sure to Include Other Input Fields or else you will lose your Actor output when this step is run.
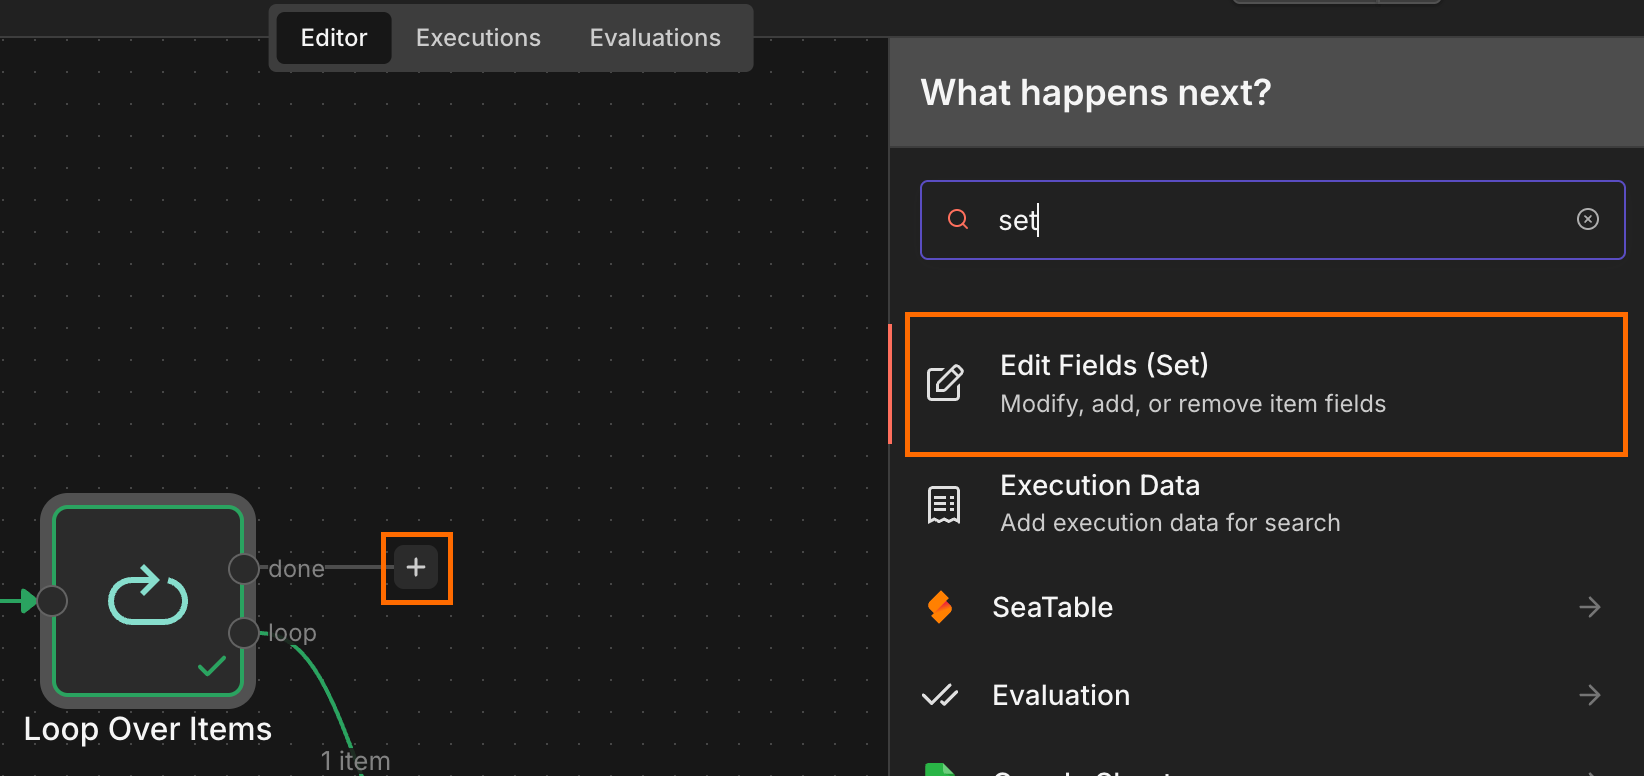
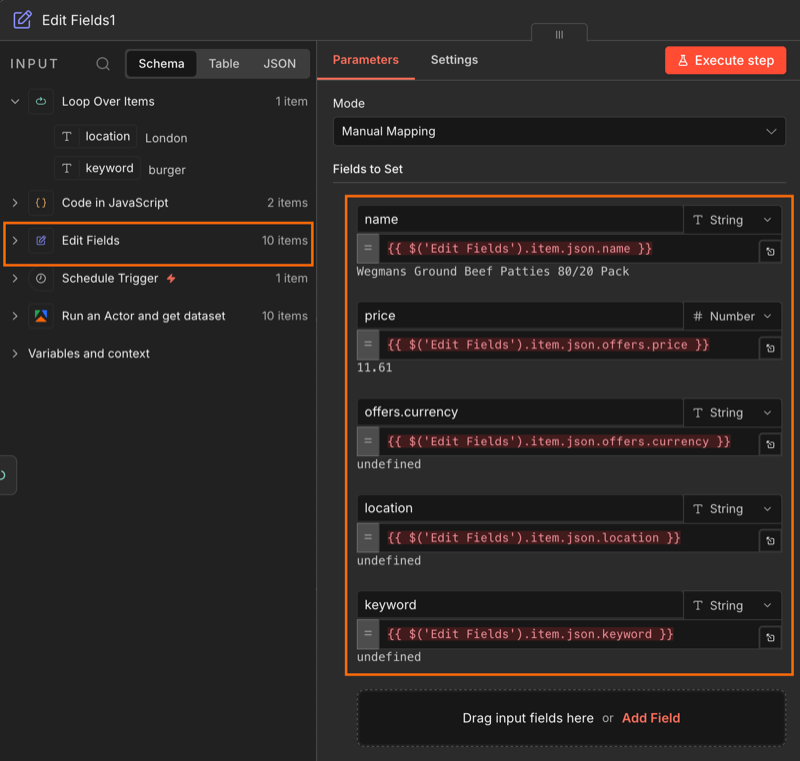
Step 7: trim the output
Connect a second Edit Fields (Set) node to the done branch of your Loop node. This will be used to filter out any unnecessary fields.
Drag and drop each item from the Edit Fields node. Some items will show as undefined until the workflow runs - that’s expected.
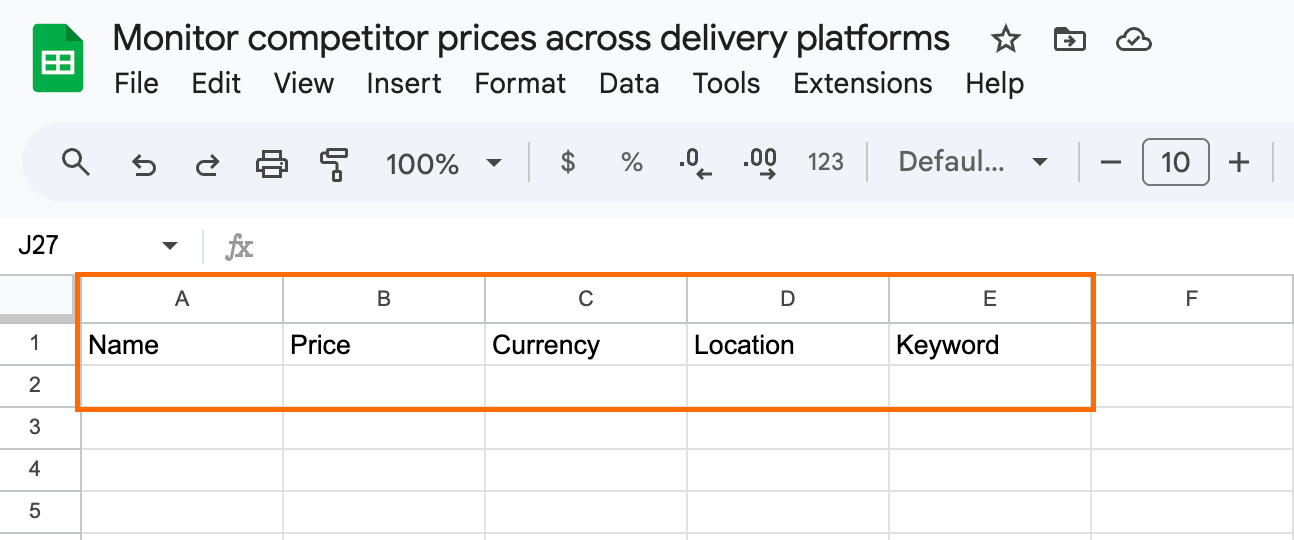
Step 8: connect to Google Sheets and run the workflow
Create a Google sheet, name it, and add column headers that map to the fields from the previous step.
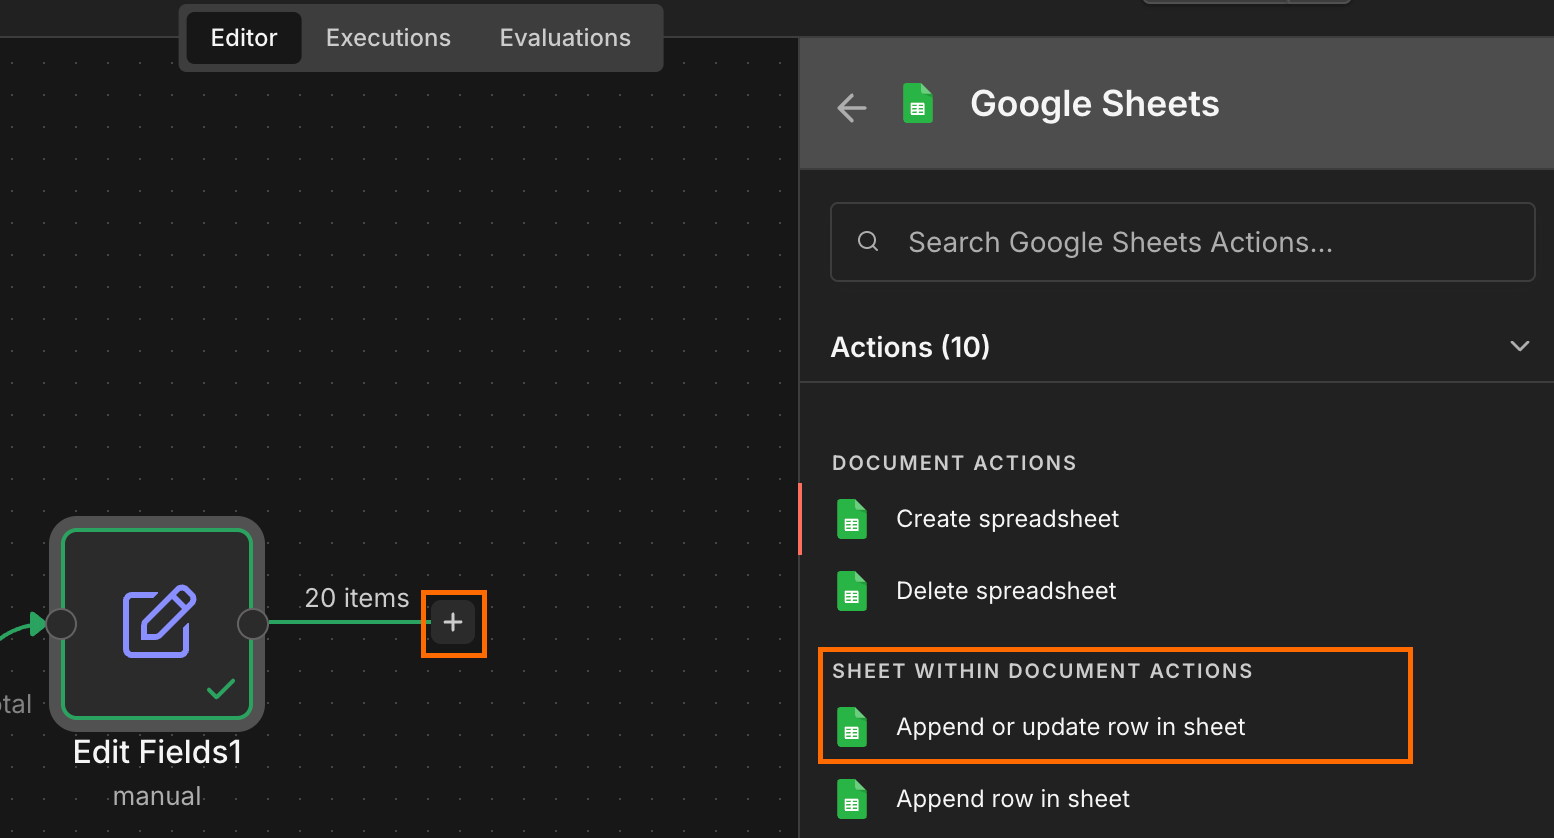
Next, connect the Edit Fields node to an Append or update row in sheet operation. Then, connect your Google account.
Select the sheet you created and map each JSON field to its column.
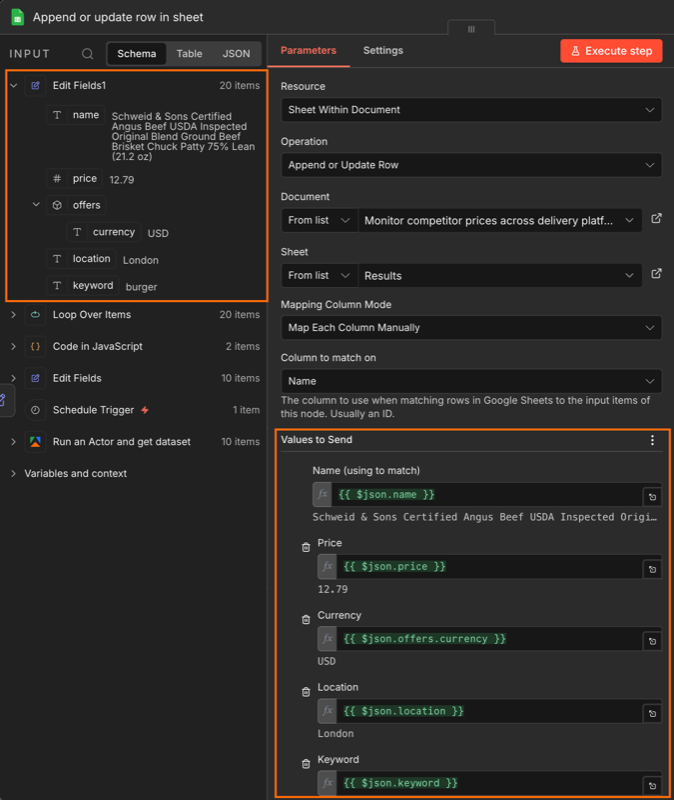
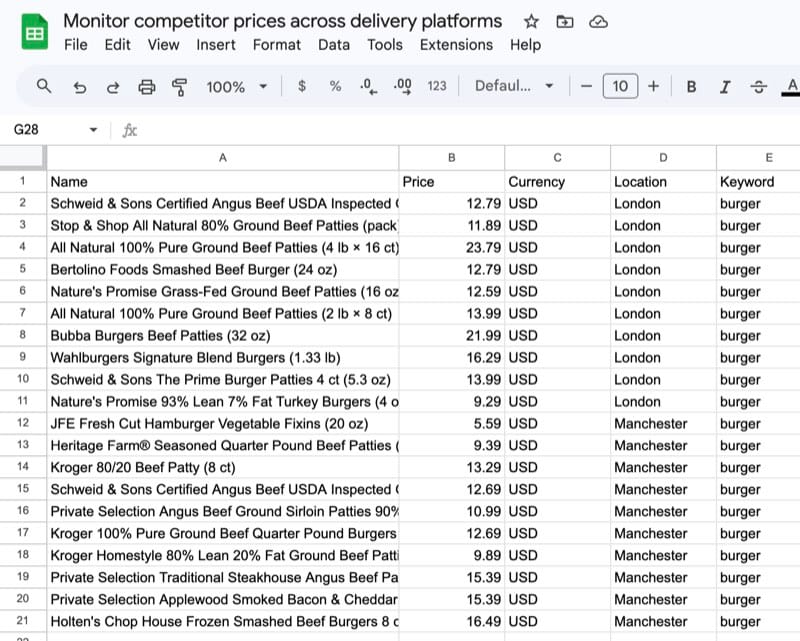
Run the workflow. The sheet should populate with one row per listing per location, tagged by city and keyword.
Conclusion
The setup above gives you a running, scheduled feed of what every customer in every zone actually sees when they open DoorDash or Instacart - your own listings alongside the competitor set, in one sheet, refreshed on whatever cadence you set. From there, the questions worth asking (”which zones have we lost on price? Which have new entrants we hadn’t noticed?”) have data behind them.