Print the stack trace of an infinite loop in a Node.js application running in a Docker container using GNU debugger (GDB) and Kubernetes’ livenessProbe.
Debugging infinite loops in Node.js code locally is easy — just launch the debugger, break the execution, see where your code is stuck, fix and you’re done. However, in production systems, this becomes much more complicated.
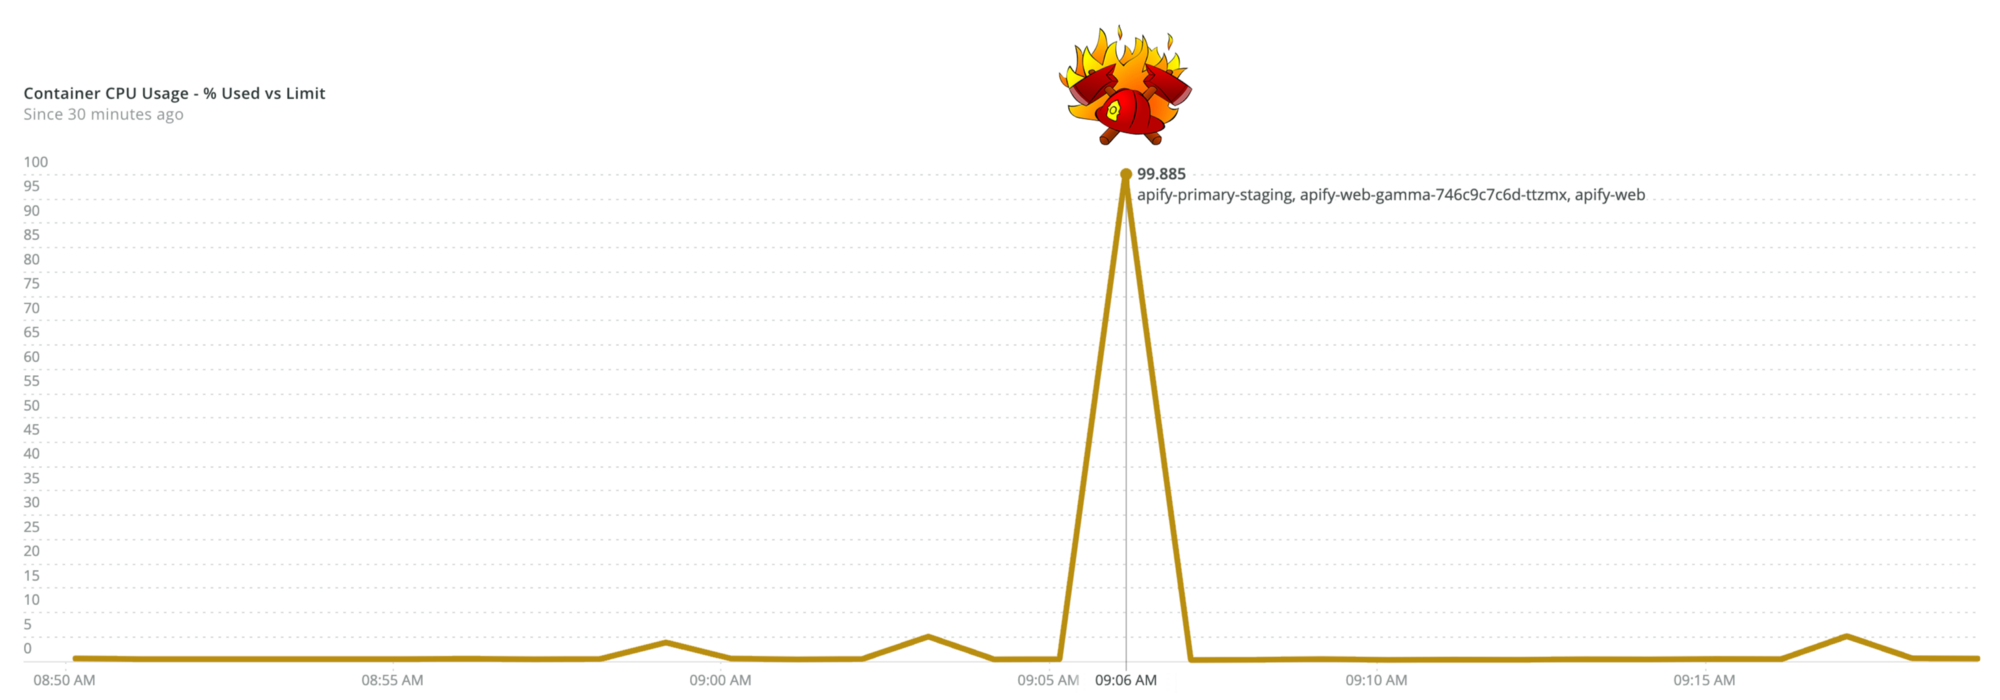
Node.js doesn’t have any out-of-the-box tool to break a running program and print its stack trace. So, when your production code suddenly peaks at 100% CPU, it’s tricky to find out where exactly it got stuck. Neither -prof nor -cpu-prof (native Node.js profiling tools provided with the V8 debugger) helped since the infinite loop in application code was caused non-deterministically.
At Apify, we had this type of problem in a production application running inside a stateless Kubernetes (K8s) container. The application is a simple express.js based web server. This article describes the solution that worked for us. Hopefully, it can also help you.
TL;DR GitHub GNU debugger livenessProbe persistent volume
Using the GDB debugger in the app container
As a Node.js developer with a basic knowledge of V8 and the underlying C++ code, you probably haven’t used GDB for debugging your Node.js applications. You probably have no use for it most of the time but in this specific case, GDB proved to be extremely useful.
GDB allows you to attach the debugger to a running Node.js process and set up a breakpoint in C++ where the infinite loop occurs. This place in V8 is called the stack guard and we got the idea to use it from this GitHub gist (it includes an explanation of the whole script if you need to know more).
Deploy any scraper to Apify
With some basic knowledge of GDB and V8’s stack guard, you can reproduce the steps that cause the infinite loop and print the stack trace of your app’s code where it occurs. The code below attaches a breakpoint to the stack guard and prints the stack trace.
You can easily test it by running a simple Docker container with GDB installed. First, run an infinite loop, then run the GDB command.
Below are the steps for testing it in your local terminal using Docker.
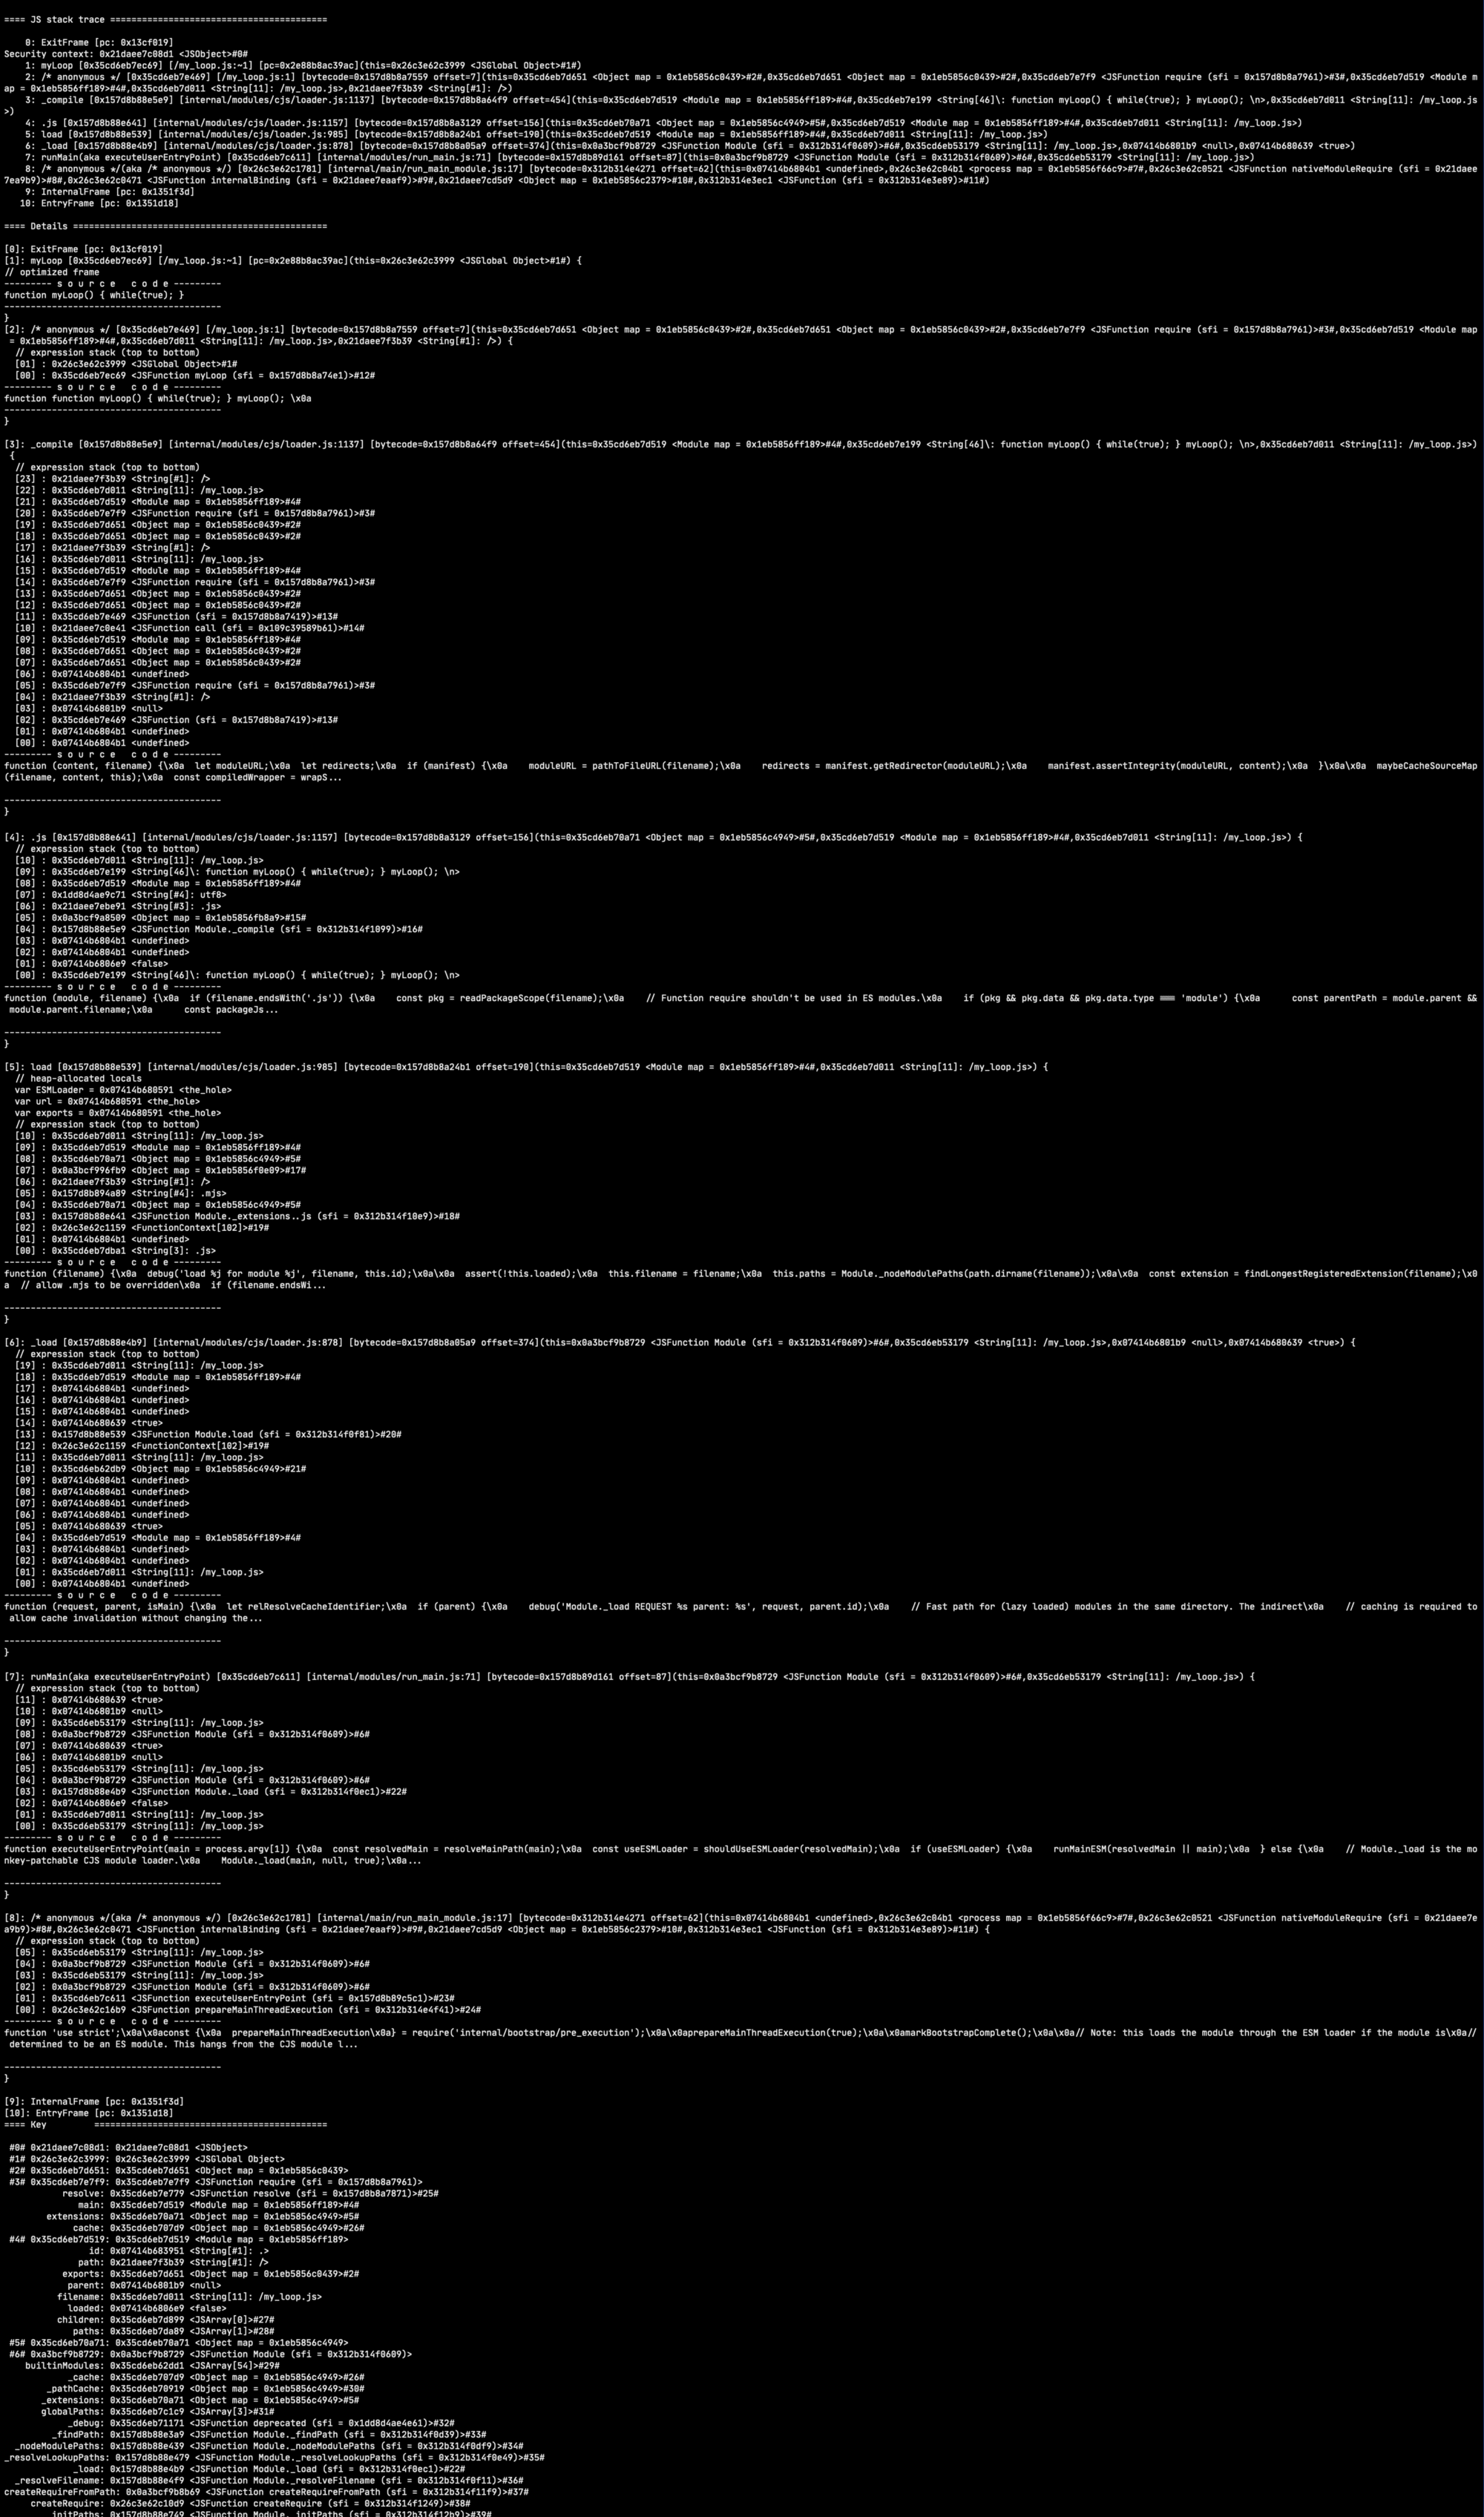
After running these commands, your terminal should display myLoop function’s stack trace.
Update K8s deployment to use the GDB script
Now you know how to get the infinite loop’s stack trace, you can use it in the production container. First, add GDB to your Docker container. In this case, update the Dockerfile using the commands used in the test.
apt-get update
apt-get install gdb
Below is the Dockerfile for this scenario.
Now you have GDB installed in your Docker container, you need to ensure that the GDB command will be attached in case of an infinite loop. As mentioned above, our loop was caused non-deterministically, so we used the liveness probe command to find it.
In our case, we had a basic HTTP liveness probe check set up. It checks the /health-check path every 5 seconds, allowing 3 failed attempts.
If this probe fails a 4th time, the K8s scheduler pronounces the container as dead and replaces it in the pool. This place in the container’s runtime where the container is pronounced as dead is the place where the GDB command will need to run.
You want to preserve the loop-causing behavior; however, if the health check fails, the GDB script should run and save the infinite loop’s stack trace into a specific file. The bash script below does exactly that.
This saves the script as liveness_probe.sh into your app’s root directory. You can see that the bash script does exactly the same as the HTTP liveness probe. However, if the health check fails 4 times, it runs the GDB command and prints the stack trace.
To use this script in our app, we needed to edit the liveness probe in the K8s deployment specification as shown below.
This ensures our health check script runs every 40 seconds, which is enough time to run HTTP probe 4 times every 5 seconds. But be careful: since we’re using a debugger here, we need to allow processes using process trace with the SYS_PTRACE flag.
We can do this using securityContext in K8s deployment.
Saving the stack trace file to a persistent volume
Once you are able to track and print the loop into a specific file, you need to ensure that the file will not be deleted after the restart. The application runs as stateless, so after the container restarts, you lose all the data in memory and storage.
To attach a persistent volume to your K8s pod, you can follow these steps. The attachable volume is a little different on each K8s-managed cluster. Our app uses the AWS Elastic Kubernetes Service (EKS), which is easily compatible with the Elastic File System (EFS).
You can do a very basic setup of EFS by running the command below.
aws efs create-file-systemFrom the output, you will need the FileSystemId property for further use. To attach EFS as a persistent volume to your EKS cluster, launch the Amazon EFS CSI Driver. After installing it, let your application know about it by creating a StorageClass K8s resource.
Next, create a persistent volume and persistent volume claim.
Note: Use FileSystemId as volumeHandle.
Finally, mount the persistent volume claim to the deployment.
When the persistent volume is set up, use SSH to connect it to one of the app’s containers. The files containing stack traces will be in the debugger folder.
Conclusion
To summarize, our app had a non-deterministic infinite loop, which occurred only on production. We identified it by attaching the GNU debugger to the app’s Node.js processes, which allowed us to print the leaking code’s stack trace. We then ran Kubernetes’ livenessProbe check to get the stack trace and save it to a persistent volume.
In our case, the infinite loop was caused by a third-party package.
We hope you will find this article useful if you encounter an infinite loop in your Node.js application.
Additionally, we added a sidecar container into k8s cluster to sync stack trace files directly to AWS S3 bucket. If you are interested in how we did it, let us know in the comments, and we will describe it in a future blog post.


