This is the translation of a data analysis blog post written by Michaela Szilvásová and Lucia Otiepková for Czechitas Data Academy. Inspired by the book on combatting disinformation by Ján Markoš, Data Academy students decided to dedicate their data project to analyzing the Czech media narrative of the ongoing war in Ukraine. You may find the original article in Slovak here.
Introduction
"The word is the atom of speech. Word choice distinguishes a populist from a responsible politician, a jerk from a gentleman, an egotist from a humble person. Words can signal impending violence…. Hatred towards a person or a group of people can take root in speech and thus lay the ground for future acts of violence.
There are words that almost certainly will stir up emotions in the public mind. Other words can signal a belonging to a certain subculture…. With an accurate choice of words, [it is] possible to influence the reader's judgment almost without them noticing it... "
— Markoš, 2019
With these words, Ján Markoš begins his book, The Power of Reason in a Crazy Age, a work that has been a major influence on the choice of our project's topic. This book is a great manual for developing critical thinking towards the disinformation projected by the news media and social networks.
Challenges in defining a topic for the project
From the project's inception, we knew we wanted to focus on text analysis. When we were considering topics for the project, the war in Ukraine was escalating. Thus, our project's direction was determined.
Our original idea was to detect fake news or propaganda techniques using machine learning algorithms. However, this idea was not quite feasible since we could not create an algorithm without already available labeled datasets in Czech. Labeling such a dataset would be a challenge of its own. People label data, and people have their own opinions and, most importantly, biases. Distorted data will directly impact the entire algorithm. Therefore the result of our labeled dataset could be biased. Another factor was that, in many cases, not everyone has enough media literacy to identify propaganda and be 100% sure which content they consume is fake and which is not.
Another idea was to analyze content about Russia and Ukraine published on Czech disinformation websites. (Un)fortunately, internet association cz.nic shut down 7 disinformation servers, which did not play in our favor. At the time of writing this blog post, we discovered that disinformation websites in the Czech Republic are up and running again.
Ultimately, we decided to focus on mapping the language Czech media used before and after the Russian invasion in February. We chose the Czech media specifically because they are not analyzed to such an extent as English-speaking media sources. Finding methodology and tools for analyzing English texts is also much easier. Therefore, analyzing the Czech language was also a challenge.
The aim of the project was to map out the media language regarding the war in Ukraine. We focused on keywords related to the political figures and entities, such as Putin vs. Zelensky, Russia vs. Ukraine. We also made a comparative analysis of different media sources in terms of quantity and analyzed the articles' metadata (number of articles over time, publishers).
In our work, we focused on 6 main Czech media portals:
- aktualne.cz
- novinky.cz
- i-dnes.cz
- i-rozhlas.cz
- lidovky.cz
- parlamentnilisty.cz
There were several questions we wanted to investigate:
- Will media interest in the war in Ukraine decline after the invasion?
- Are the media more focused on Putin or Zelensky?
- Which phrases are most associated with Russia and Ukraine?
- What are the main phrasing trends of the Russo-Ukrainian war?
The process
We obtained our data by scraping articles using the Apify platform. The process itself had 2 steps:
Step 1: Find articles (their URLs in particular) about the Russia-Ukraine conflict.
Step 2: Scrape the article content.
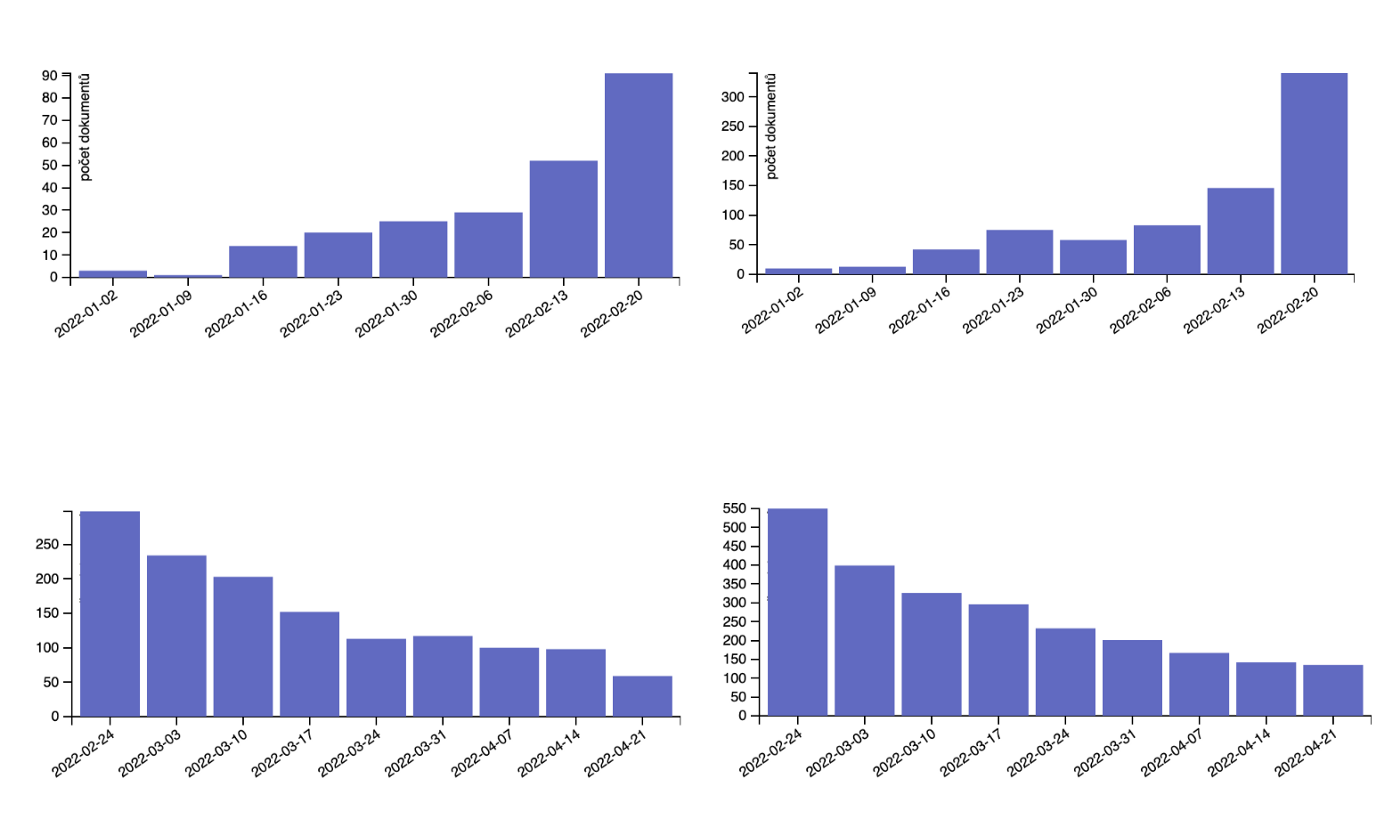
To find the articles, we used a tool called Smart Article Extractor. We started scraping the articles from January 1, 2022. You can see the resulting number of articles in the table below. After a detailed look at the data, we found out that the scraper had delivered plenty of results. However, many of them were useless to our project, e.g., links to photo galleries, interview recordings, and online reports. We were missing a lot of article texts, so we removed the useless links from the datasets altogether. Unfortunately, doing this significantly reduced the number of articles.

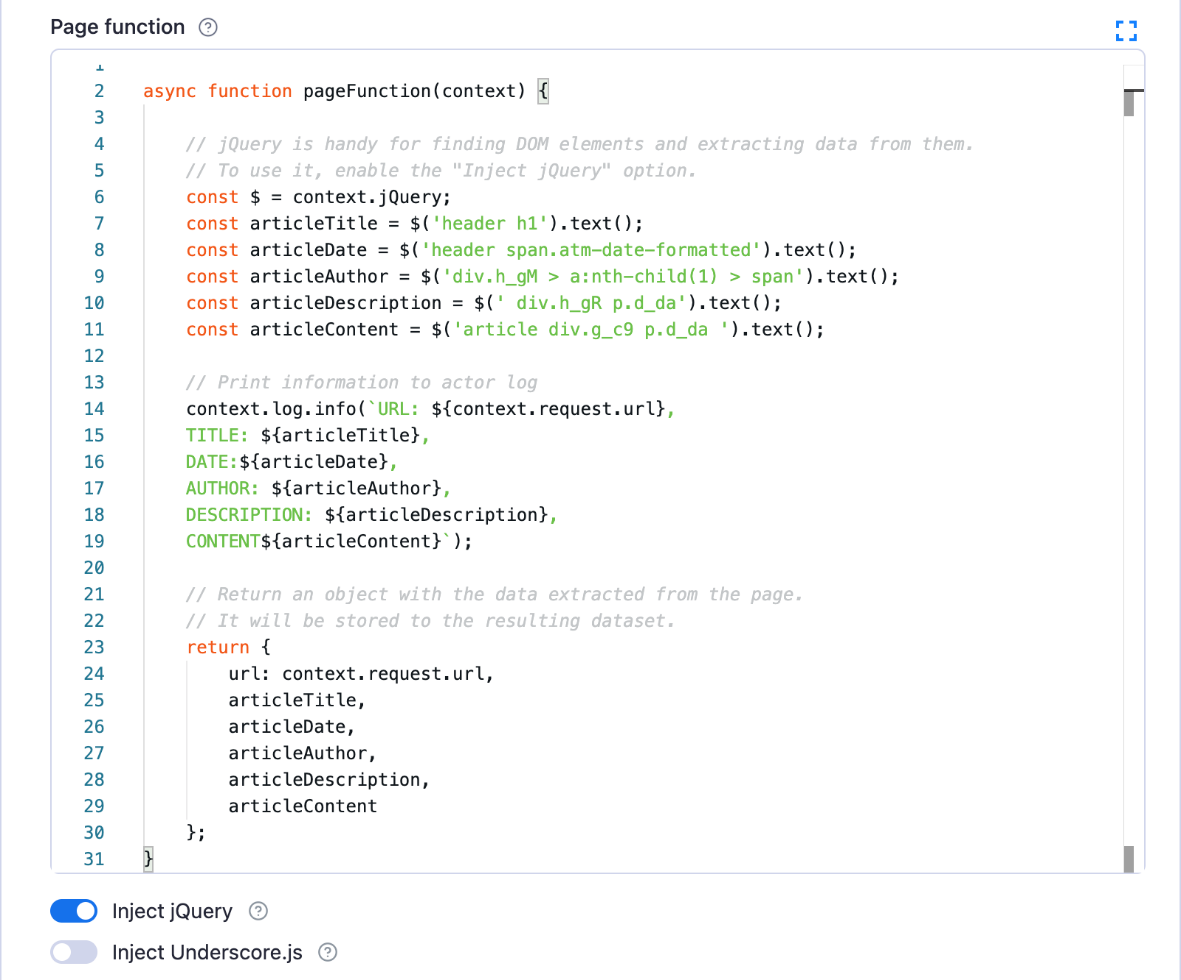
Since Smart Article Extractor was not able to extract all the content necessary for our research (article text in particular), we needed to set up a second data extractor: we decided to use the more generic Apify Web Scraper.
Each news website has a different HTML structure for displaying content. So we needed to set up Web Scraper for each medium individually. We decided to use the JavaScript library jQuery and coded a few scraper settings (Page Function).
Data cleaning
The data was cleaned using Python. Each scraped medium had its own specifics, but the cleansing principle remained the same.
We got rid of unnecessary columns:
data.drop(list(data.filter(regex = 'links/')), axis = 1, inplace = True)
data.drop(list(data.filter(regex = 'videos/')), axis = 1, inplace = True)
data.drop(list(data.filter(regex = 'tags/')), axis = 1, inplace = True)
data.drop(['author/0', 'canonicalLink', 'copyright',
       'image', 'lang', 'loadedDomain', 'loadedUrl', 'softTitle', 'text'], axis = 1, inplace = True)
As our next step, we defined keywords that would target the most relevant links. We used those keywords in their basic form to capture all variations of the given words. Not every keyword was ideal for our case though. For example, the word war showed many links related to wars going on in other parts of the world besides Ukraine.
data = data[data['url'].str.contains("ukrajin|rusk|putin|zelensk|valka|invaz|moskv|kyjev")]We exported the sorted links and, based on them, used Web Scraper to extract the content. We also exported a cleaned dataset in CSV format, which contained relevant data for further analysis.
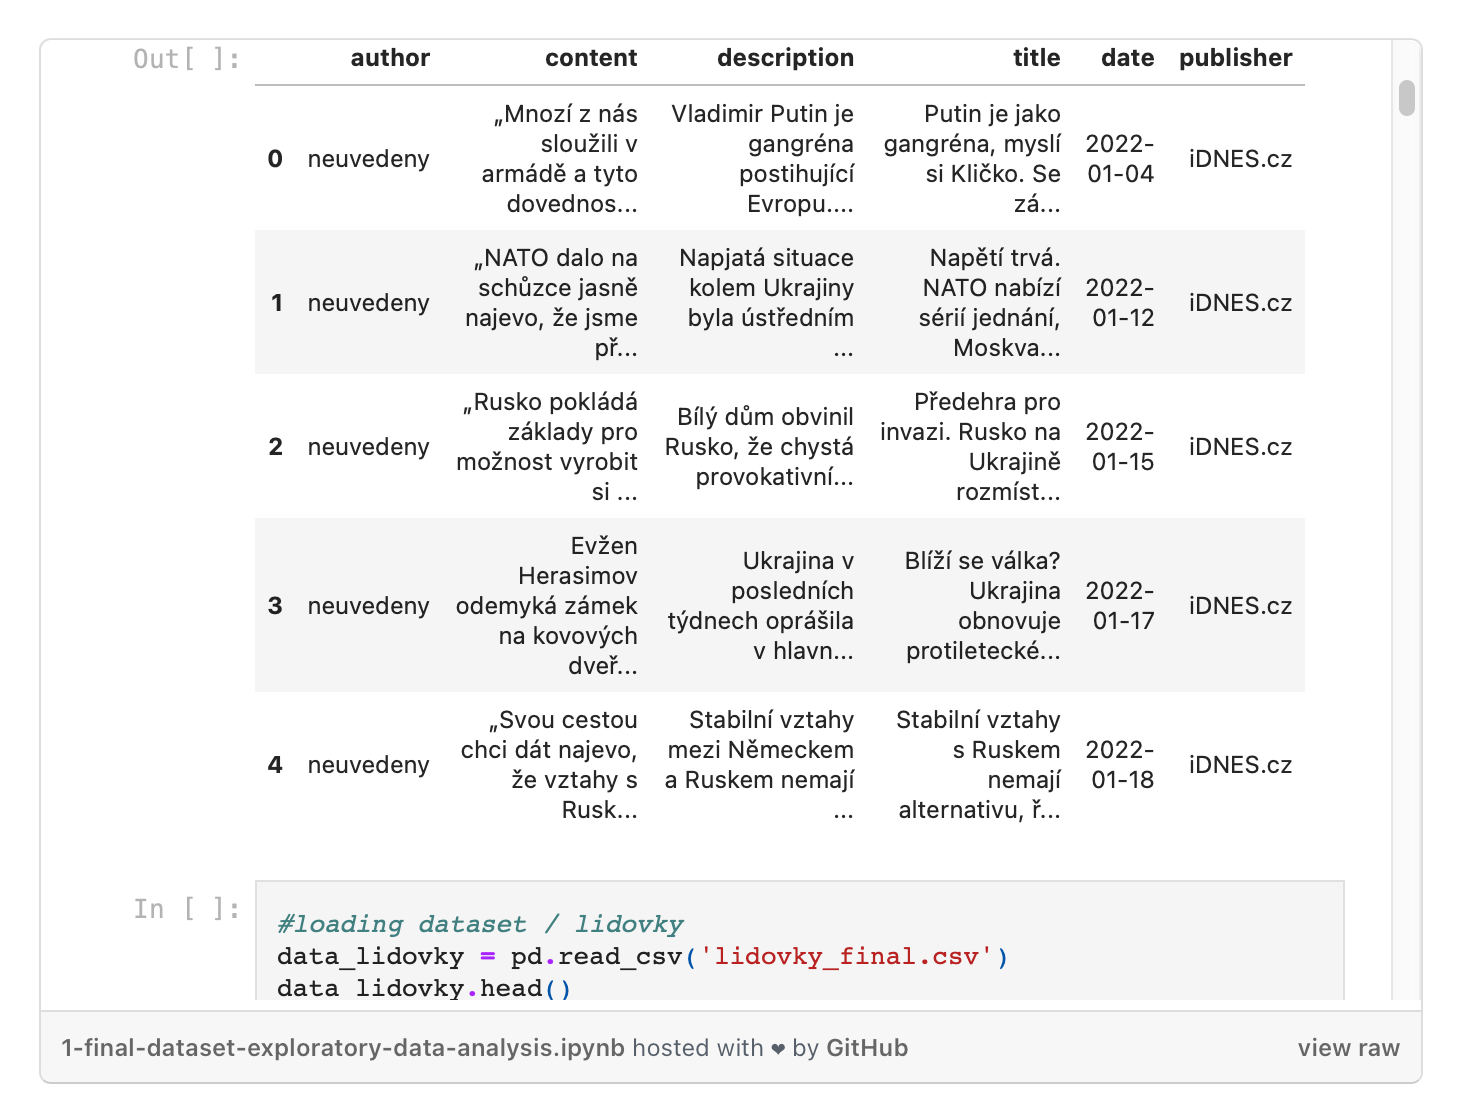
In another Jupyter notebook, we combined the text extracted from Web Scraper with the cleaned dataset from the first scraping task based on the same URL. This is how we created a dataset specifically related to the war in Ukraine.
new_data_text = pd.merge(data_text, data_clean_aktualne, on = 'url')
new_data_text.head()
We converted the dates to datetime and arranged the articles chronologically:
new_data_text['date'] = pd.to_datetime(new_data_text['date'])
new_data_text = new_data_text.sort_values(by='date')
We dropped unnecessary columns and renamed the others:
new_data_text.drop(['url', 'articleDate', 'description', 'title'], axis = 1, inplace = True)
new_data_text.rename(columns = {'articleAuthor':'author', 'articleContent':'content', 'articleDescription':'description','articleTitle':'title' }, inplace = True)
Again, each medium was different in terms of column names or date formats. But the principle remained the same everywhere: find phrases, clean, rename, organize by date, and export the final dataset for each medium. You can find the details of the entire data analysis process on Google Collab.
The final dataset
In the final notebook, we combined all the cleaned datasets:
df = pd.concat([data_idnes, data_lidovky, data_irozhlas, data_novinkycz, data_aktualnecz, data_pl], ignore_index=True, sort=False)The final dataset was cleaned, exported, and prepared for visualization. While cleaning the data, we ran into a few obstacles. The first problem was the dates: each medium used a different date format, so the dates had to be converted and unified. Another obstacle was the author name: varying formats, changing author abbreviations, indicating author instead of publisher, or no mention of the author at all (parliamentary letters and idnes.cz).
Our resulting dataset was not large — working with more data and retrieving it would require way more time. We obtained all the data by web scraping it, which made it possible to adjust to the specifics of each media website. The result was a smaller but more accurate and cleaned dataset.
As part of exploratory data analysis, we also looked at visualizations in Jupyter Lab. We used both seaborn and matplotlib libraries. At this point, we found out that google collab, where we uploaded our notebook, does not support visualizations in matplotlib. Therefore they are only visible in Jupyter Lab. For the purpose of visualization, we divided the dates into bins:
df['diff_days'] = pd.cut(df['diff_days'], [0, 30, 60, 90, np.inf],
                        labels=['<30 days', '>30 days', '>60 days', '>90 days'],
                        include_lowest=True)
Jupyter notebook with the final dataset and visualizations:
Dataset processing and visualization in Geneea
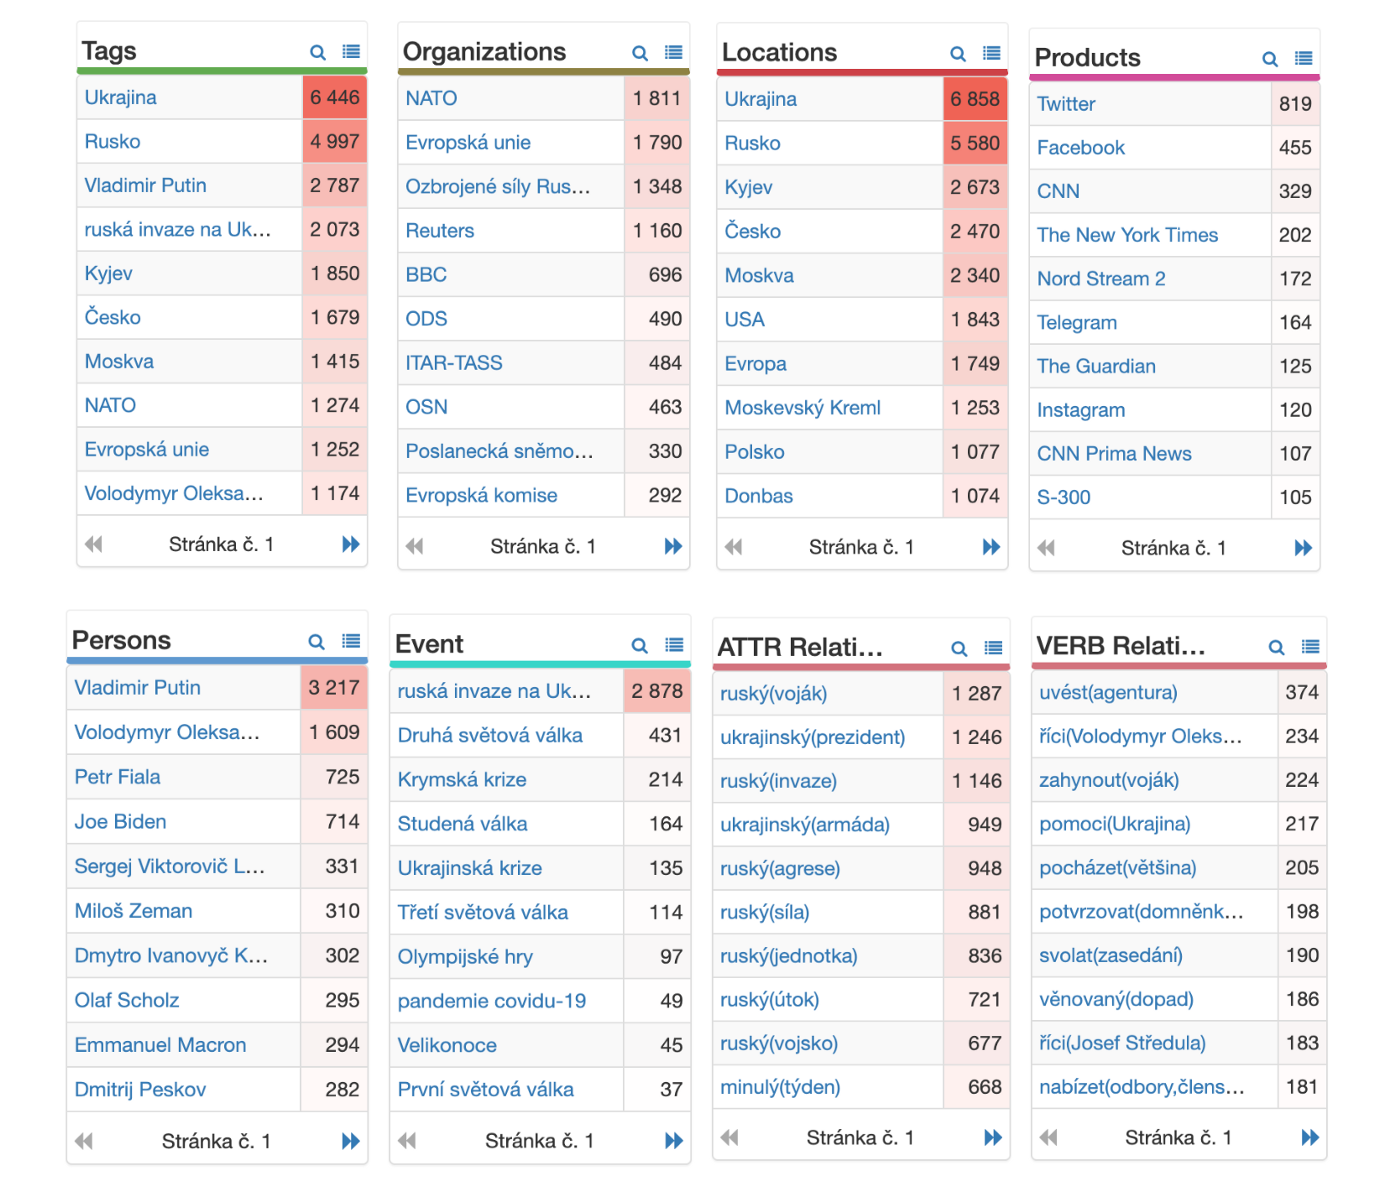
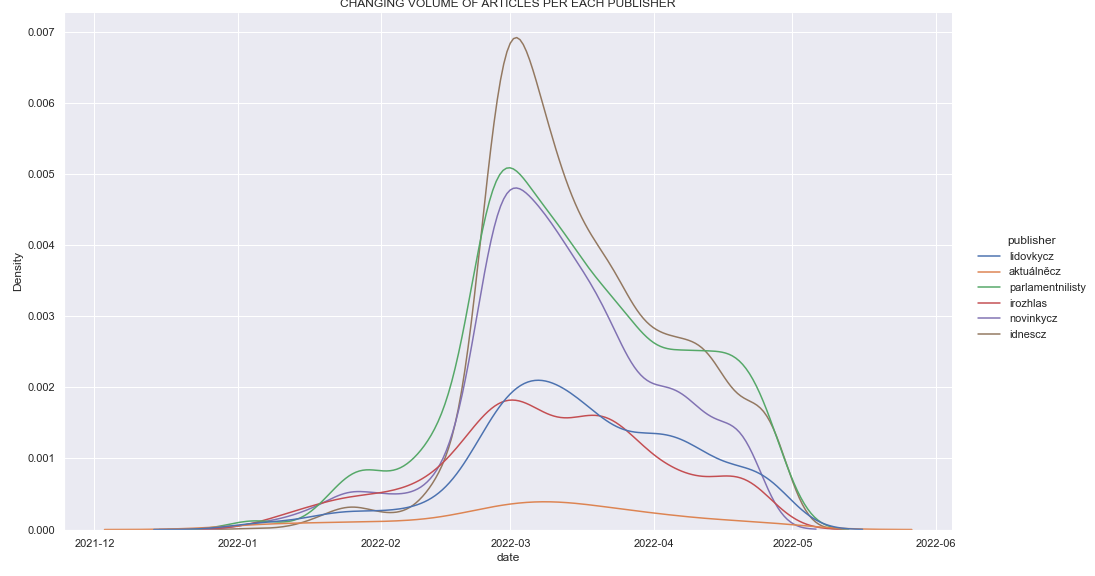
Now the cleaned dataset containing more than 7,000 articles had to be processed in the NLP platform Frida (from Geneea). Frida lemmatized our data and created a list of tags, entities (persons, products, locations, organizations), and relationships between entities and their attributes.
The following graph confirmed our first assumption. It shows the number of articles between January 1 and the end of April 2022. From the graph, there is a clear, sharp increase in interest and publishing rate of articles after the invasion. It’s also noticeable that after a month, media coverage reduced its attention to the war in Ukraine by half. The visualizations have confirmed the same trend in the Jupyter lab.

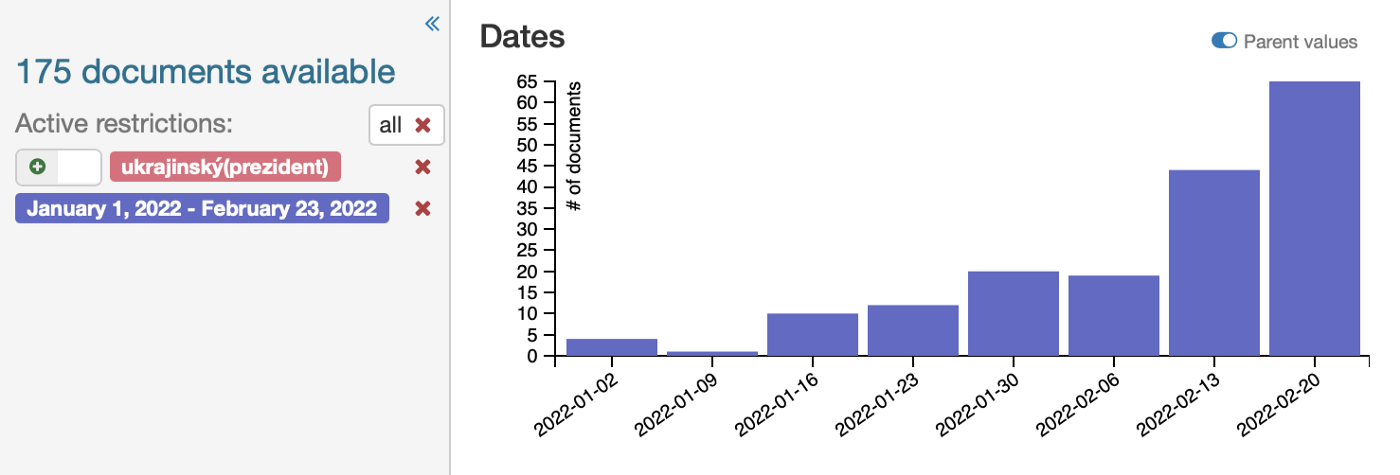
Frida also helped us to answer our second question. Its interactive dashboard allows for person-filtering by time horizon. Before the February invasion (2000-23/02/2022), Ukrainian President Zelenskyi had been mentioned in only 235 articles compared to Putin, who had appeared in 767 articles. After February 23, 2022, media mentions of Zelensky rapidly increased. His name appears in articles almost six times more than before the invasion. However, Putin still interests the media more as he appears in twice as many articles compared to Zelensky.
Findings from the data and graphs
Frida (Geneea) allows the application of simple filters to phrases and their occurrence over time. For example, the phrase Ukrainian president appeared in only 175 articles before the invasion. After the Russian invasion, this phrase appears in 1071 articles. This 6x increase supports our assumption that there was not much written about the Ukrainian President Zelensky before the escalation in February.
When examining the number of articles published over time, we came across a few timing and source trends. The weekends, when fewer articles are published, resulted in a significant dip in the curve. In terms of sources, we found a trend of reposting the same information. Many media portals just reposted articles from the Czech Press Office. Some media, such as idnes.cz and lidovky.cz, belong to the same media group and therefore published the same articles. Parlamentni listy decided to go with publishing as many news articles as possible and repost the news articles from more classic media sources, e.g. from idnes.cz or aktualne.cz.
If we were to continue the project in the future, we would focus on the relations between the authors and media sources and the individual characteristics of each media organization.
Dataset processing and visualization in Sketch Engine
Sketch Engine is a tool for text analysis and exploration of how language works. Its algorithms analyze authentic texts containing billions of words (so-called text corpora) to identify what is typical and what is rare in a language. Sketch Engine is used mainly by linguists, lexicographers, and translators. It was recommended to us by our mentor. Sketch Engine contains around 600 ready corpora for more than 90 languages.
We uploaded our own corpus to Sketch Engine — a single dataset of scraped articles with a total number of 3,178,137 words.

One of the ways to track language development in Sketch Engine is with Trends. Trends can identify words whose usage increases or decreases over time. Trends takes into account word frequency as well as relative word density (comparing word frequency in a specific article type with the frequency in the entire word corpus). A good example is the word tension, which after the outbreak loses its meaning as we see a big drop right after the invasion. On the contrary, refugee is starting to appear more and more often.
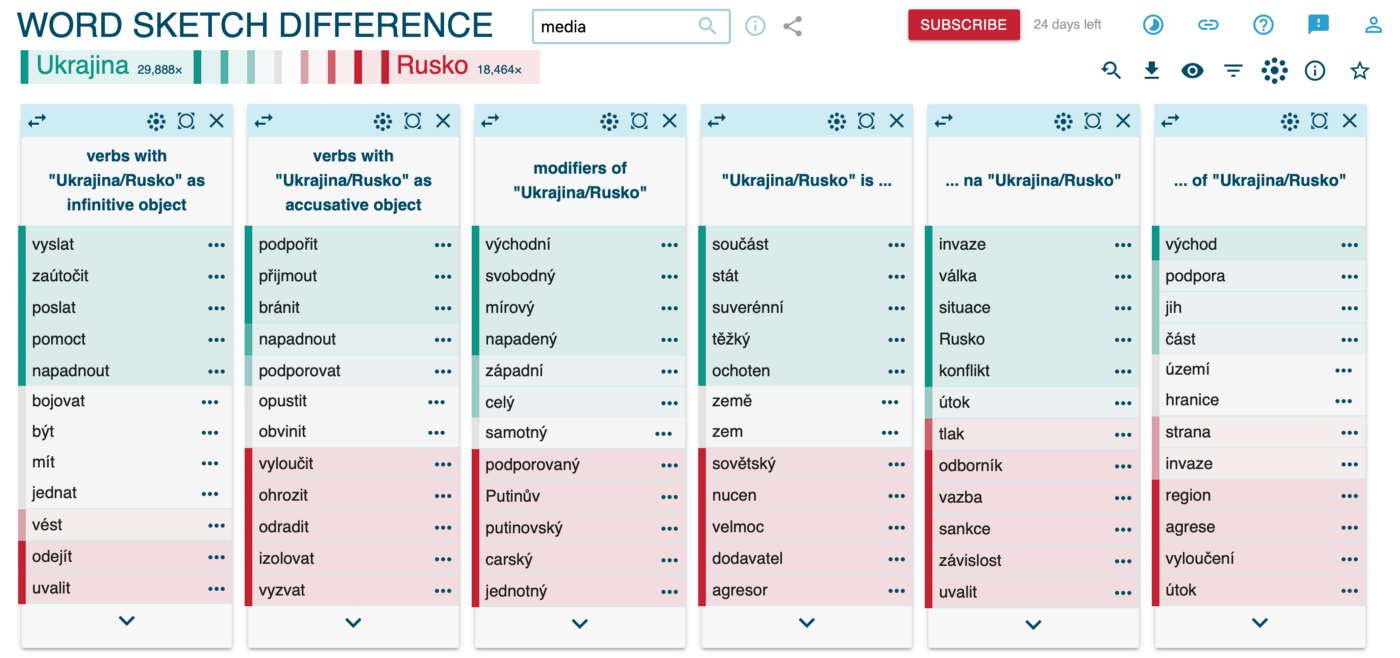
Sketch Engine also gave us a preview of collocations. Collocations are word combinations that are related grammatically and semantically. In our project, we looked at the words Ukraine and Russia and their most frequent connections with other words across the Czech media. The visualizations show the image the media created for us about both countries. Ukraine is portrayed by the media as a free country engaged in self-defense, under attach by an aggressive Soviet power state. The Russia of the Czech media is represented negatively as an attacking force and aggressor. A frequent appearance of the phrase Putin's Russia was also an interesting addition to that image.
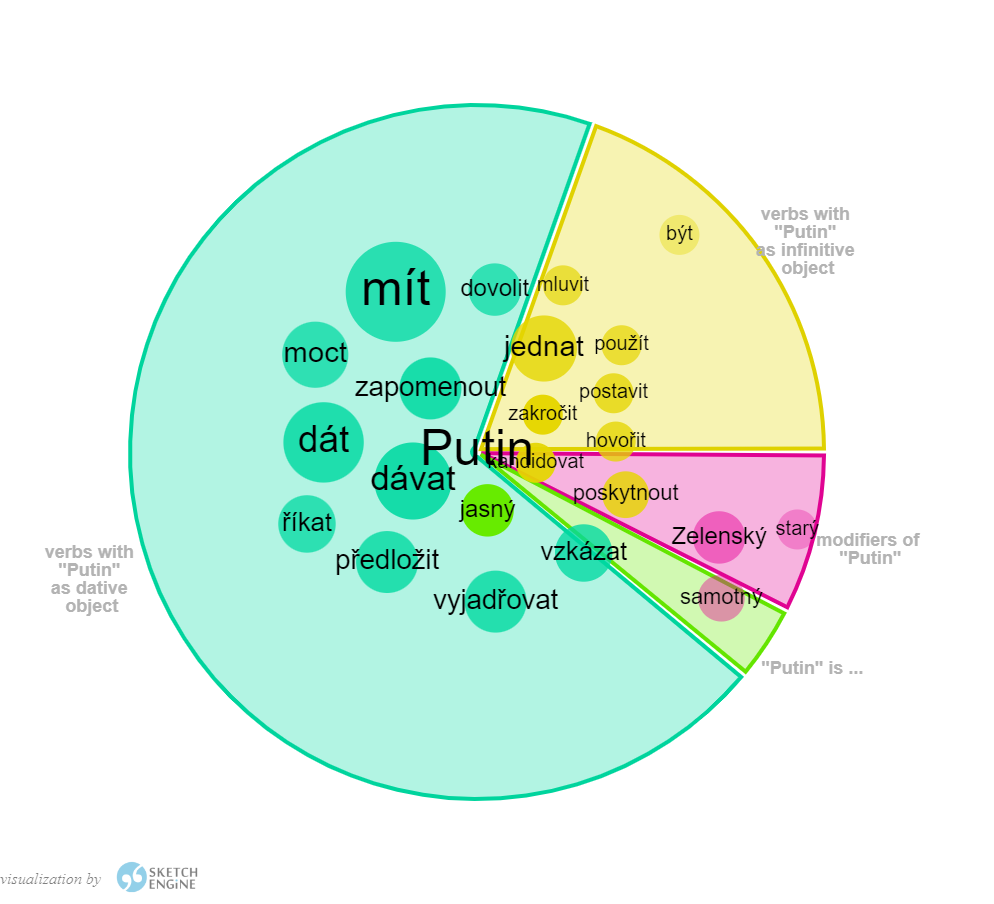
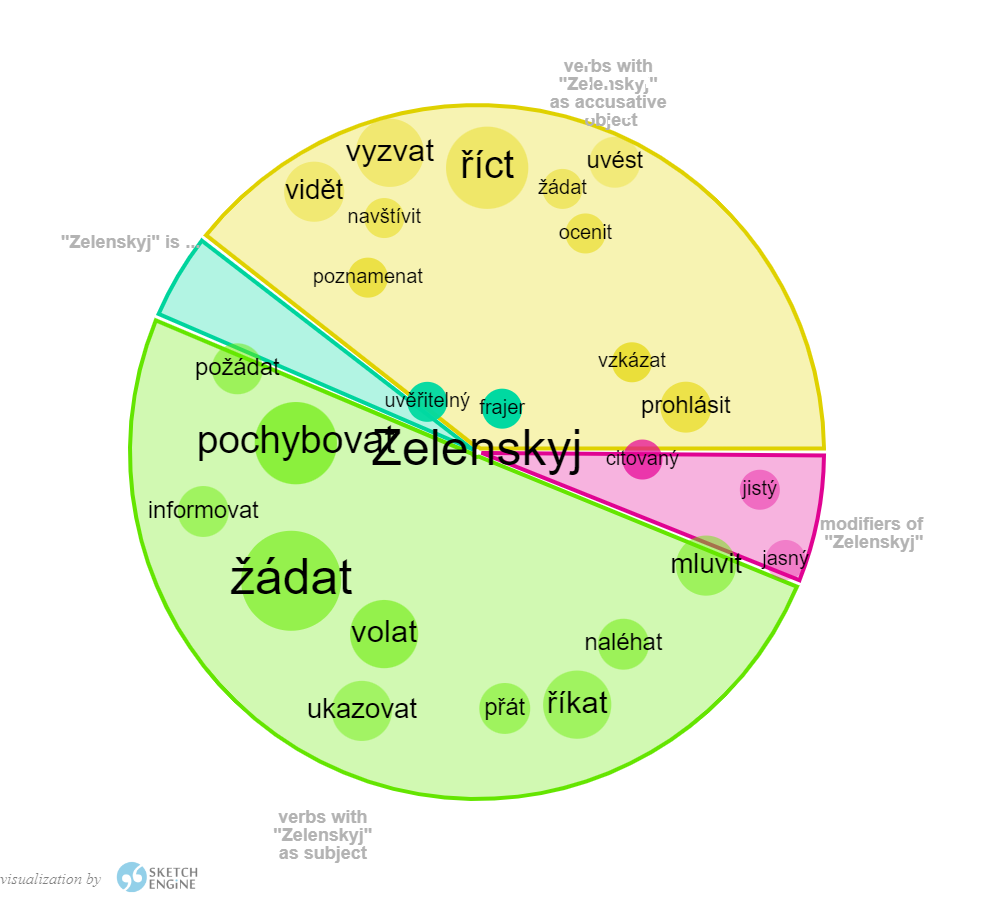
In the images below, you can see another collocation visualization for Putin and Zelensky. You can see that Putin is associated with adjectives such as lonely, old and obvious/clear. The adjective obvious/clear is also associated with Zelensky, alongside the words confident, believable, and cited, or the noun badass, which also indicates the less formal writing style of some media.
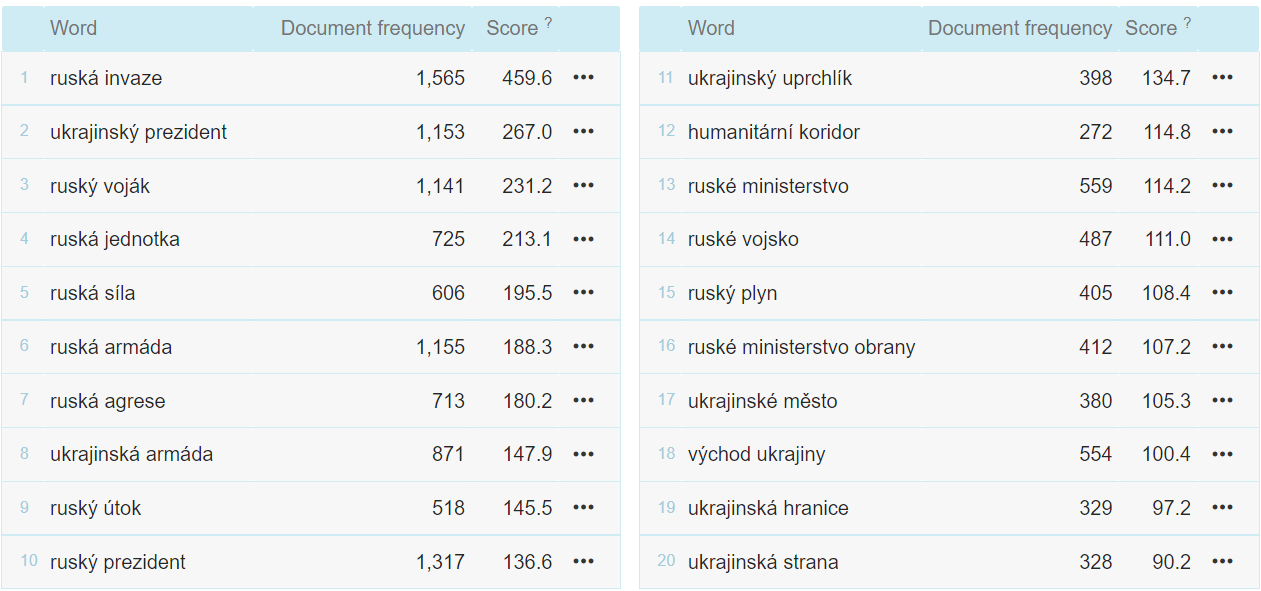
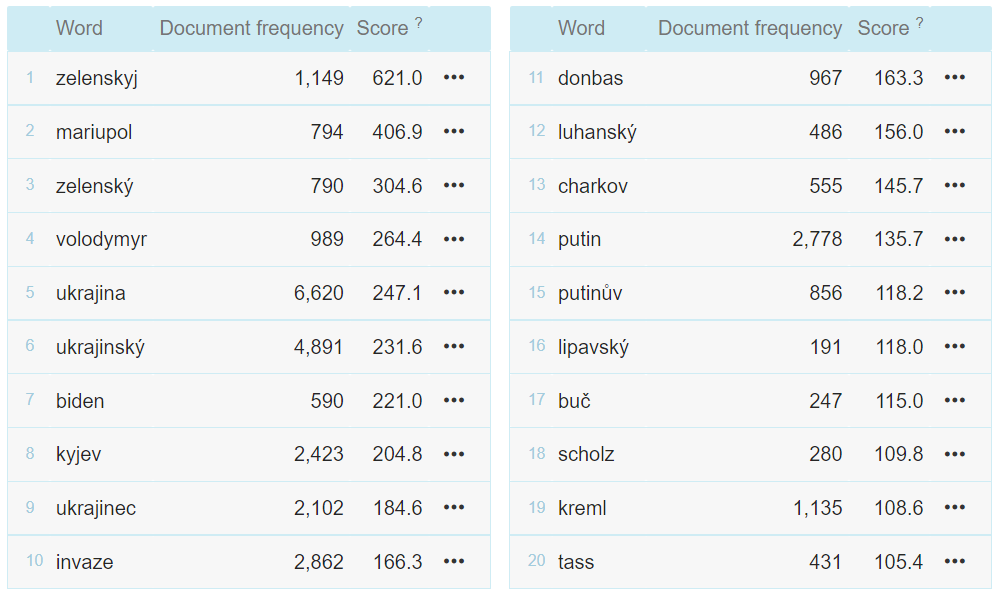
Sketch Engine also allows you to display the most frequently occurring words and phrases in media based on the score. A score is a simple mathematical calculation to identify keywords and connections. The figure below shows the 20 most frequent words and phrases based on their scores.
How Natural Language Processing works
NLP is a subcategory of machine learning. In recent years, NLP has advanced exponentially thanks to the collection of large amounts of textual data. There are two main types of NLP: natural language understanding (NLU) and natural language generation (NLG).
In our project, we focused on natural language understanding specifically. The input data had to go through a number of stages of NLP techniques: tokenization, stopwords removal, stemming, and lemmatization. Optimizing and cleaning the data for feature extraction and model training (e.g., fake news detection) was vital.
Tokenization is the process of dividing the text into smaller bits called tokens. Tokenization is generally used to separate sentences into words. For the next step, we passed the new tokenized text through a function to remove stopwords — words that occur in language frequently but do not carry any meaningful information, but have syntactic weight only.
Stemming and lemmatization are the next functions that were applied to a dataset. Stemming is a process that removes parts of a particular word to find the stem of the word. Lemmatization is similar in principle.
Last but not least, another feature that we applied to the dataset was Part-of-Speech (PoS) tagging. That means basically going carefully through the dataset and tagging each text token with a category: noun, pronoun, adjective, verb, adverb, etc. This helps to understand the context, as certain words can acquire a different meaning depending on the context.
In dataset preprocessing, sometimes extra steps are included, such as punctuation removal. These functions mainly deal with the cleanliness, simplicity, and clarity of the data. Finally, the text needs to be converted into vectors (feature extraction). Vector numbers illustrate linguistic features of the text and solve the issue of word representation in the NLP pipeline. The most popular methods of feature extraction are Bag of words and Word embeddings.
We also looked at how lemmatization works in Jupyter Lab. For lemmatization, we installed and imported the simplemma tool (Czech language version). We looked at the lemmas of some words and then applied the lemmatizer to the content of the entire dataset to be visualized in a word cloud.
import simplemma
from simplemma import text_lemmatizer
langdata = simplemma.load_data('cs')
df['lemm'] = df['content'].apply(lambda x: text_lemmatizer(x, langdata))
What's next for our project?
Our project is just getting started; it's an inspiration for a possible larger and broader analysis of the media portrayal of the war in Ukraine. We could continue scraping media sources and follow the development of language over even a longer period of time. We could also focus deeper on the initial idea for our project and analyze news articles from Czech disinformation news portals. Another option is to look specifically and in more detail at each media or switch to media analysis of other countries.
Media/news scraping and text analysis can also be used to confirm expert claims about the types of narratives media choose to use when covering the war in Ukraine.
Mario Manenti from the London School of Economics analyzed the media coverage of several major international news channels and found an interesting narrative pattern. The pattern suggests that Ukrainian citizens are more "deserving of sympathy" than victims of other military conflicts, outside the Western world in particular.
He's suggesting the reason for such a media narrative is Eurocentric bias backed by several social theories, including humans' tribal nature with its us vs. them divisions. According to this theory, we tend to express prosocial behavior - helpful and supportive behavior in particular - toward people we consider part of our social group. English presenter Peter Dobbie from Al Jazeera described Ukrainian refugees fleeing war as "a normal European family you could live next to".
Melissa de Witte from Stanford University takes a different angle on this issue. When a conflict breaks out, media interest generally skyrockets internationally. Media attention perseveres until the conflict is resolved or it becomes evident that the conflict will not end quickly. The russo-Ukrainian war has been a story of prime importance; it was also relatively easy for international journalists to visit the country. Also, it helps if the covered country is democratic and follows the principles of media freedom. There is no correlation between the scale of the humanitarian disaster and the extent of coverage of the story in the Western media, though. It's true that Ukraine is obviously getting a lot of attention right now, unlike other wars. Gradually, however, even the war in Ukraine may receive only episodic coverage, which can be partially influenced by the high financial costs of foreign journalism.
The claims of academics, sociologists, or journalists could be the subject of further research, where it would be possible to use textual analysis and support the research with data. It would be possible to explore in more detail how the media cover various conflicts in the world or how media interest changes depending on the duration of the conflict. We believe that textual analytics has huge potential, including media in languages other than English.
 Natasha Lekh