For Apify, MongoDB is not just the main source of truth for all our systems. It is a crucial element that can affect both user experience and our web scraping platform's performance. In early 2021, our users started reporting degraded performance of our UI. The cause? Over-utilized drives in our MongoDB cluster. It was time to take action and improve our overall usage of MongoDB.
This article describes some of the techniques and MongoDB Cloud features we used to debug performance issues and expose sub-optimal queries.
How we use MongoDB:
- We store metadata about our users, their Actors, Actor runs, and storage in MongoDB, but for actual data, we have separate data stores: key-value store, dataset, and request queue (see Apify Storage for more information).
- 260 million objects amounting to 200GB of data with 40GB indexes.
- 6k reads and 1k writes per second with >150MB/s transfers.
- 60GB RAM, 8 vCPUs.
Throughout the article, we will be using the Robo 3T MongoDB client and tooling provided by MongoDB Atlas, which is our MongoDB provider.
The problem
It all started with users reporting that our UI sometimes freezes for a couple of seconds or even minutes. Internally, this became known as the white-page problem, as after refreshing the browser, users got stuck on a white page.
During this incident, not all the application pods were affected at the same time, so we started to dig into our framework first. Our main application is built using the Meteor framework. We found out that certain database queries make the Meteor backend unresponsive until the query is resolved. These queries would take the longest when MongoDB drive utilization was at its peak. We did some experiments that confirmed the correlation between the white-page problem and over-utilized MongoDB drive, then started working on optimization.
We mainly focused on optimizing:
- How often certain queries are run to decrease utilization when reading.
- Number of indexes to decrease the utilization when writing.
- Better utilization of replicas.
- Queries with high response lengths.
Profiling queries in real time
This section will describe the tools and methods we used to debug slow-running queries in real time. This works great when combined with proactive alerting on badly performing queries and also when optimizing a locally running application.
Using the MongoDB profile level
If the profiling level is enabled, the profiler captures and records data on the performance of write operations, cursors, and database commands on a running mongod instance.
Usage is simple:
- Connect to your MongoDB instance with the client of your choice and call
db.setProfilingLevel(2). - Profiler starts capturing running commands into the collection
db.system.profile. - Wait a bit, then disable the profiling again with
db.setProfilingLevel(0).
Note that db.setProfilingLevel() has many options to let you configure what kind of queries you want to capture. The level 1 setting captures slow queries only. See its documentation for more information.
Now, with recent commands stored in the db.system.profile collection, you can easily analyze them with MongoDB queries and additional JavaScript code. For example, here I aggregate the number of queries per collection and filter:
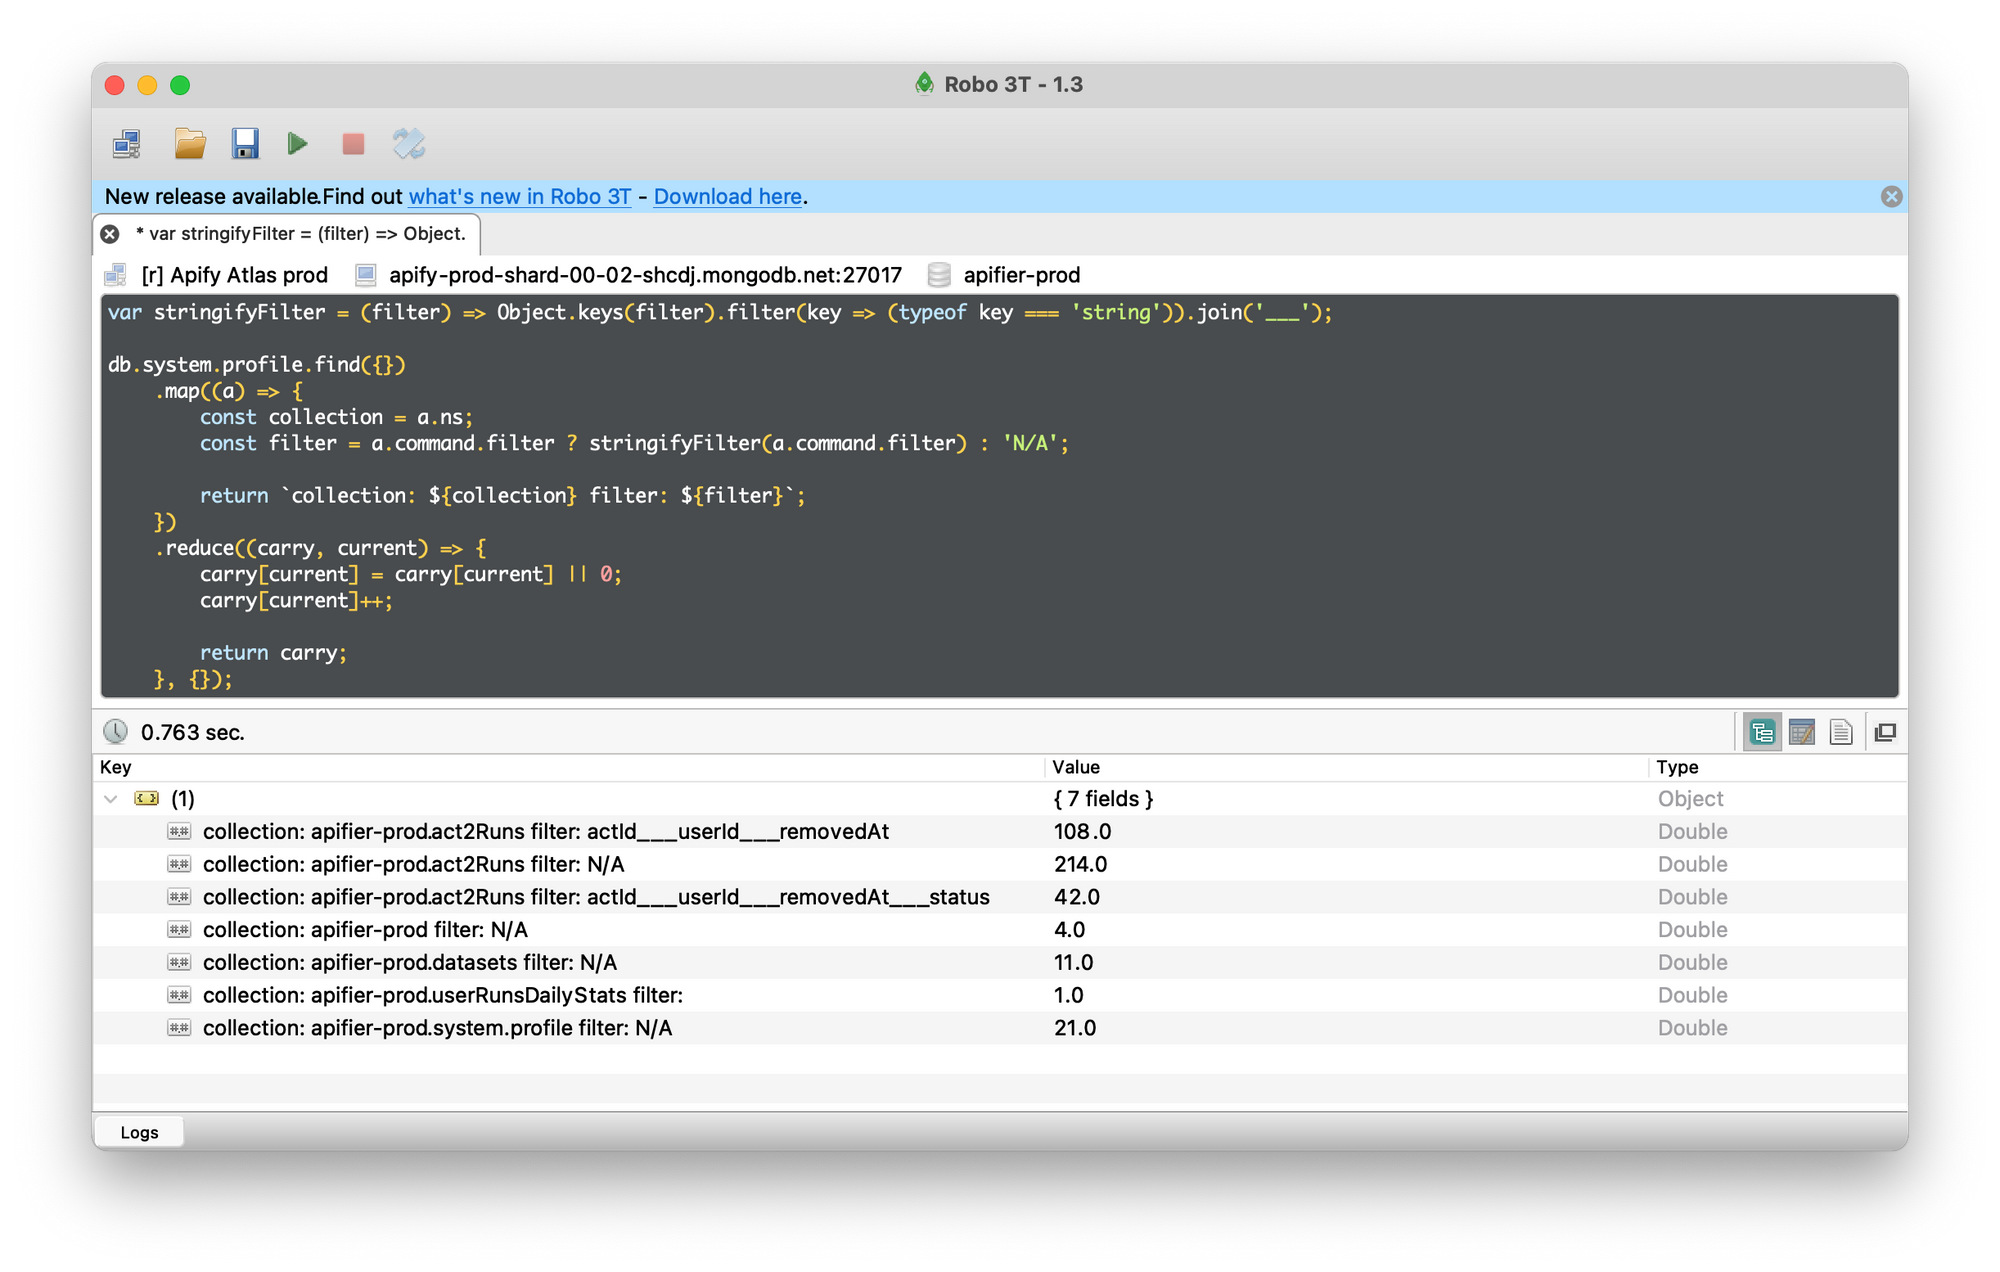
We used this method to:
- Identify frequently run queries as candidates for caching. We have a caching system based on Redis, where we store responses for frequently-run queries for a couple of seconds in order to decrease the number of read operations.
- Find queries that are data-transfer heavy, as each record also contains the response's number of items and size. We had a few queries with responses of even a couple of MBs, so it was important (and easy) to update our UI to load the data in a more agile way when needed. This helped us optimize our network transfer from about 250 MB/s to 150 MB/s.
- Identify and remove duplicate queries made at different levels of our API for certain API calls. For this, we used the profile level locally to capture ALL queries made after a certain endpoint call was called.
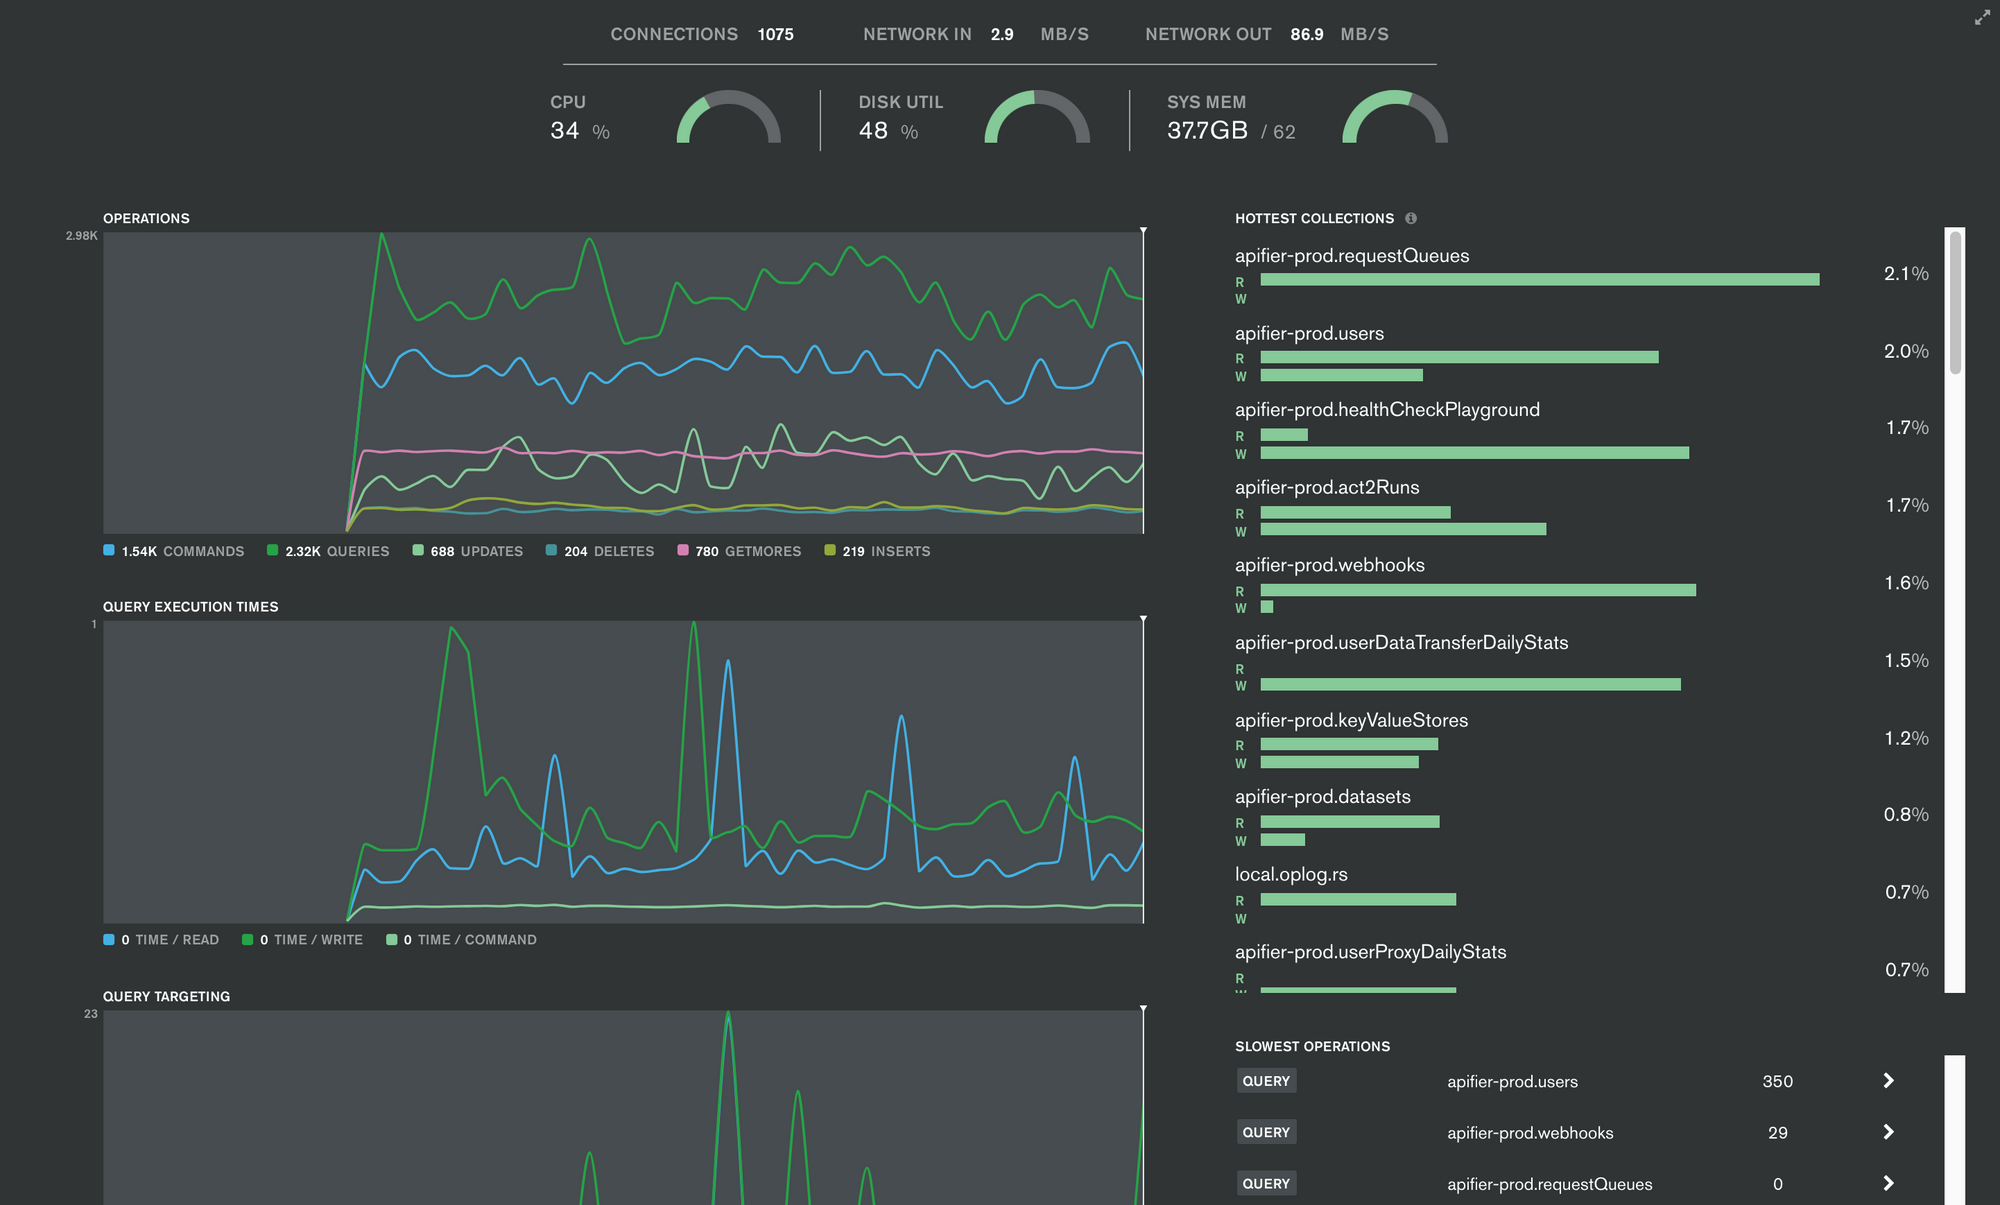
Using the Atlas real-time view
We set up over a dozen different alerts for our MongoDB cluster and connected them to Pager Duty and Slack.
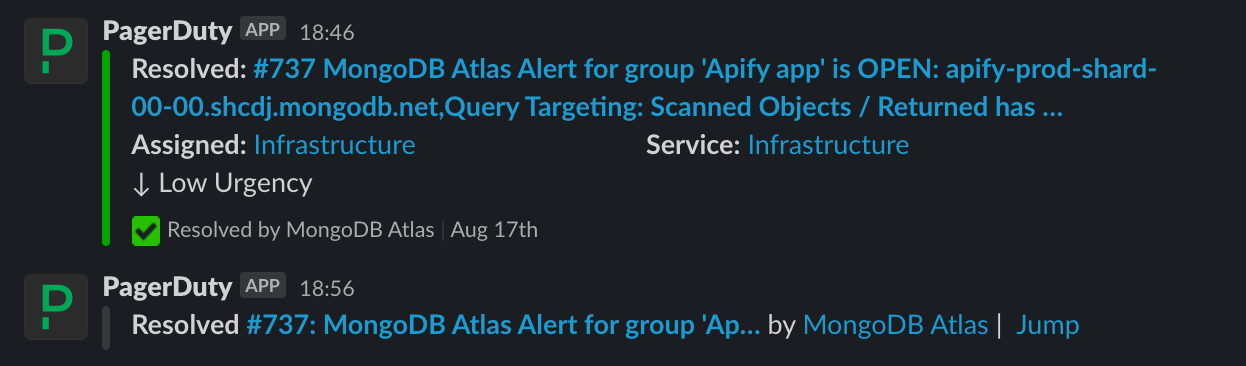
As our on-call engineers are notified of incidents in real time, they can use the MongoDB Atlas real-time view to quickly analyze and capture sub-optimal queries.
Time-traveling using the Atlas profiler
Not all problems can be debugged in real time, so MongoDB Atlas provides a profiler that captures sub-optimal queries based on metrics such as:
- Operation duration.
- Number of keys examined.
- Keys examined/returned ratio.
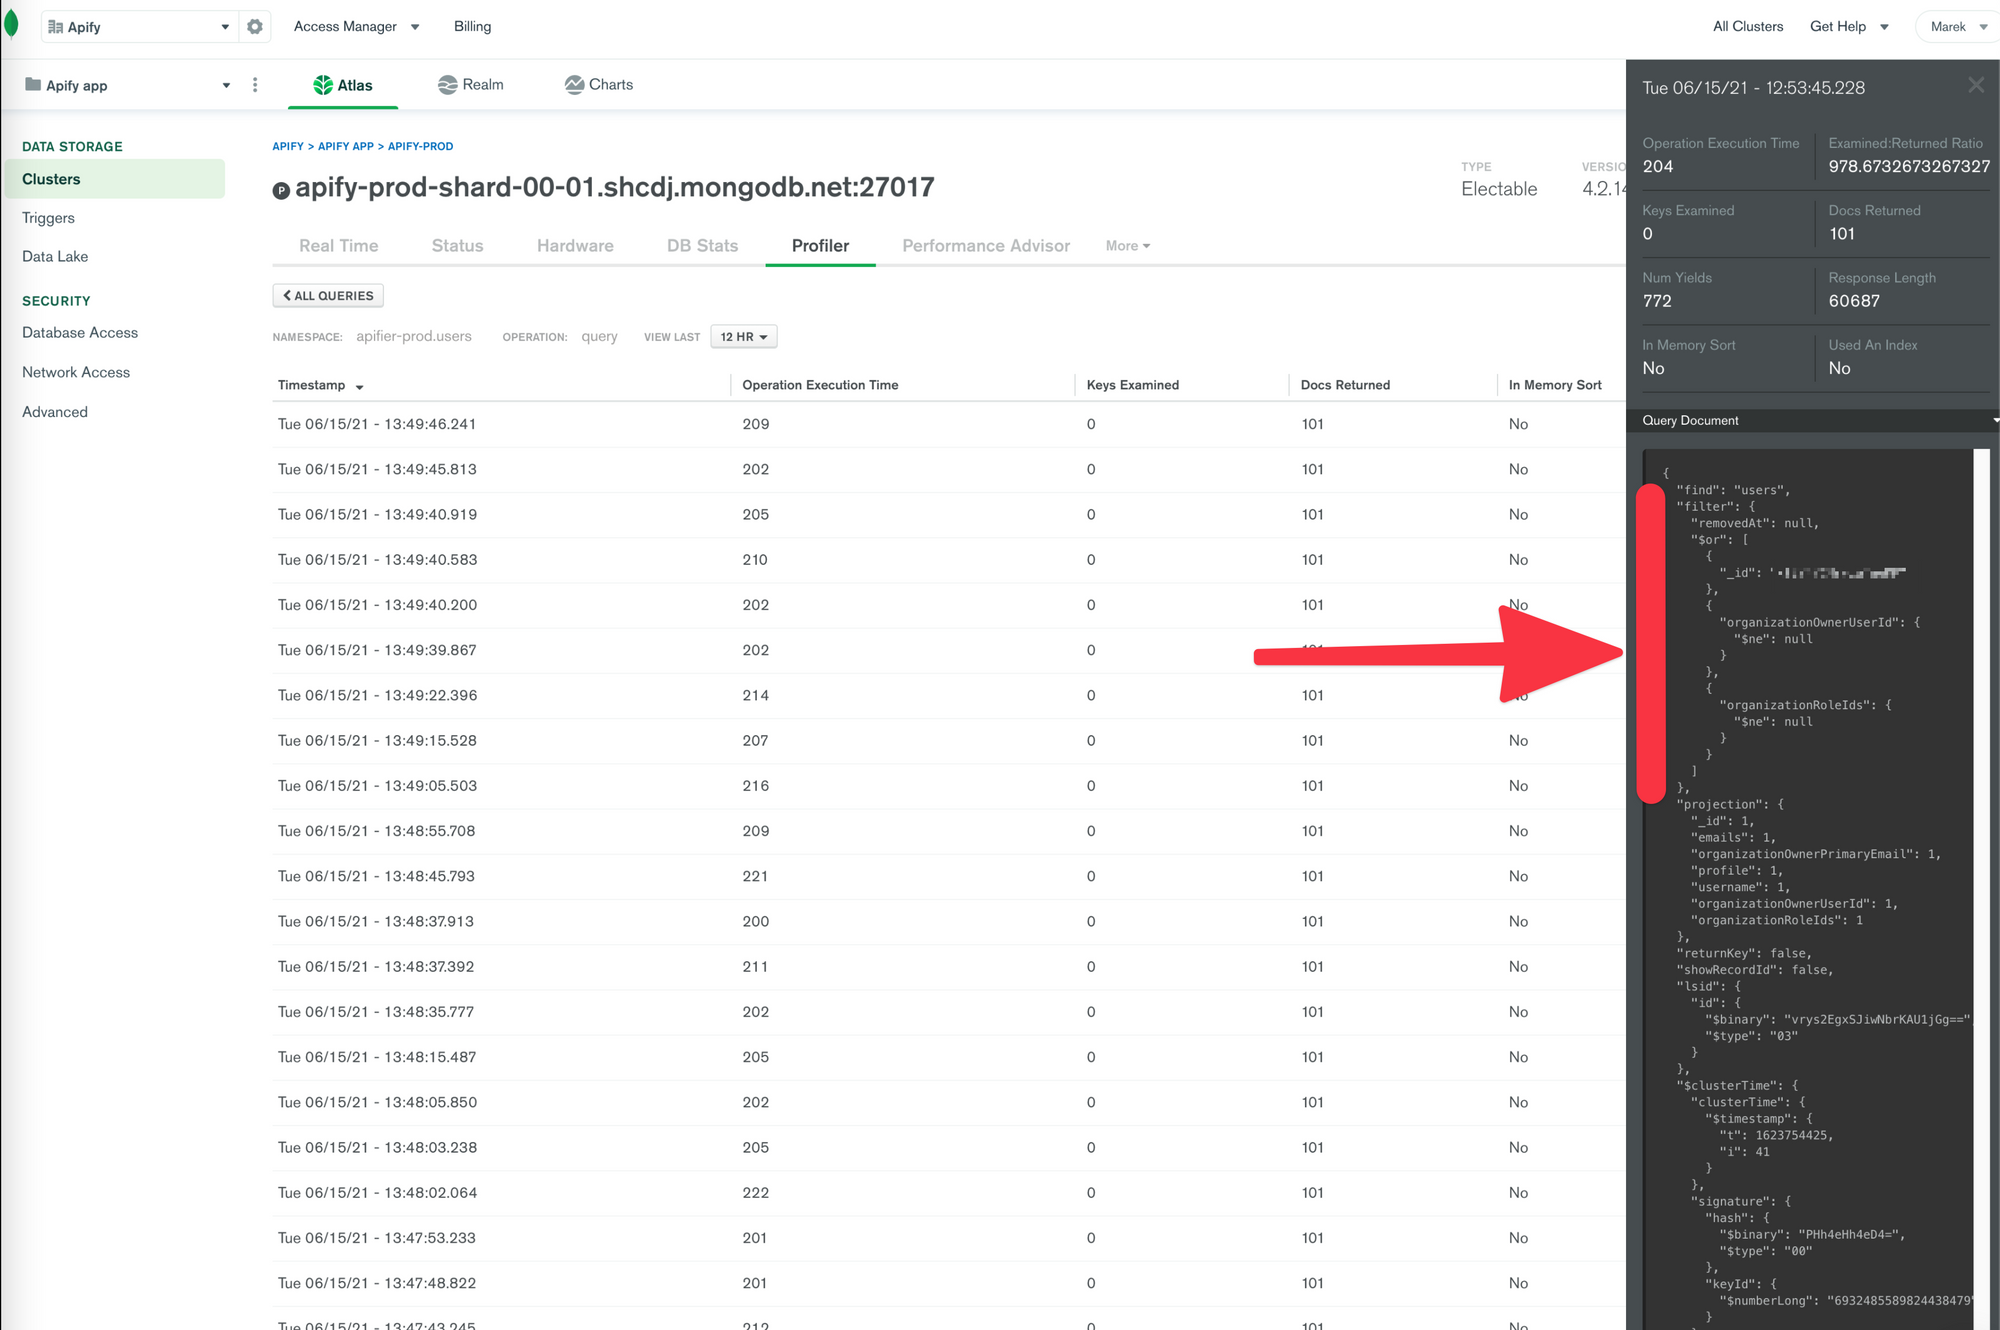
A real-life story from the usage of MongoDB Profiler: one morning, I saw a series of email alerts for a high number of scanned objects. I opened the profiler and saw a waaaay toooo loooooooong line of these queries:
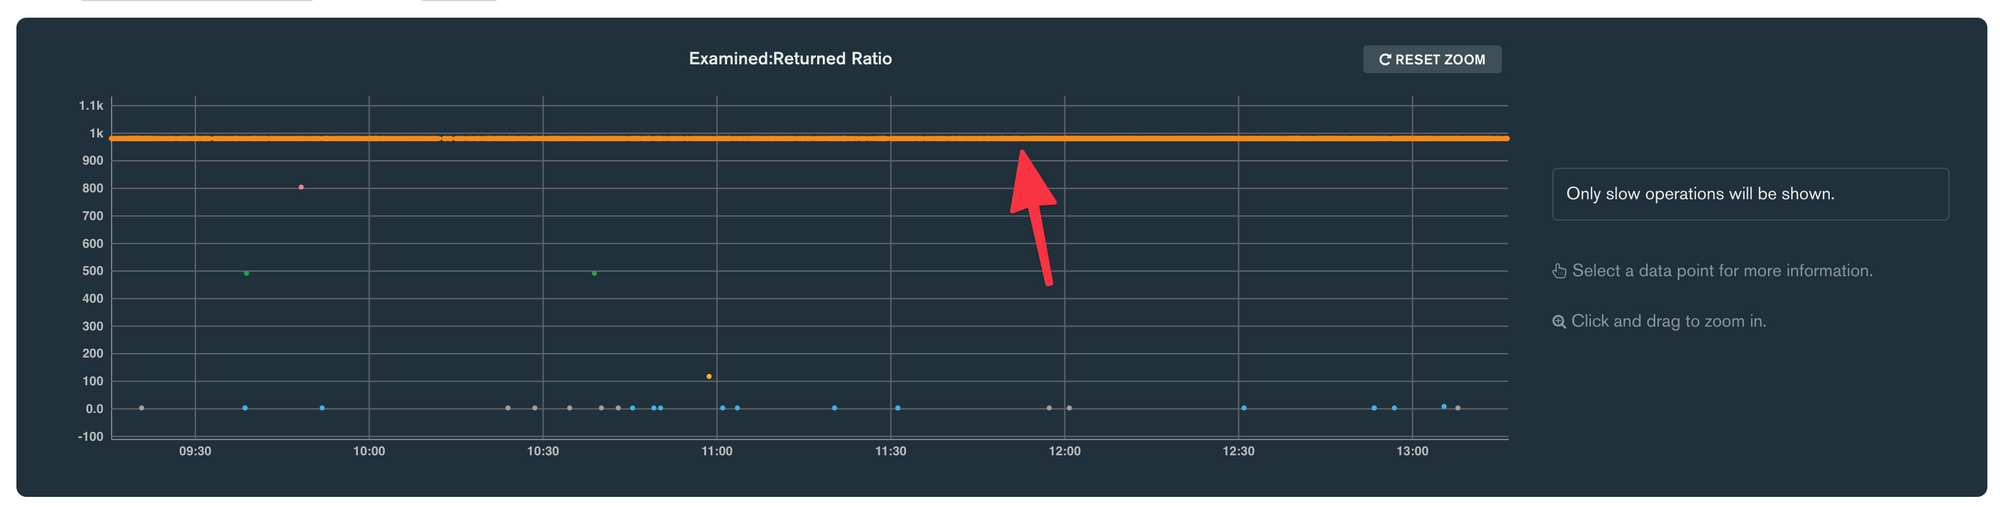
The orange line shows queries with an examined/returned ratio of 1000. This means that for each item returned by the query, MongoDB must read 1000 items, likely from the drive. This is very inefficient and a sign of a badly used index. So, I clicked one of the inefficient queries, curious to see what the query filter looked like.
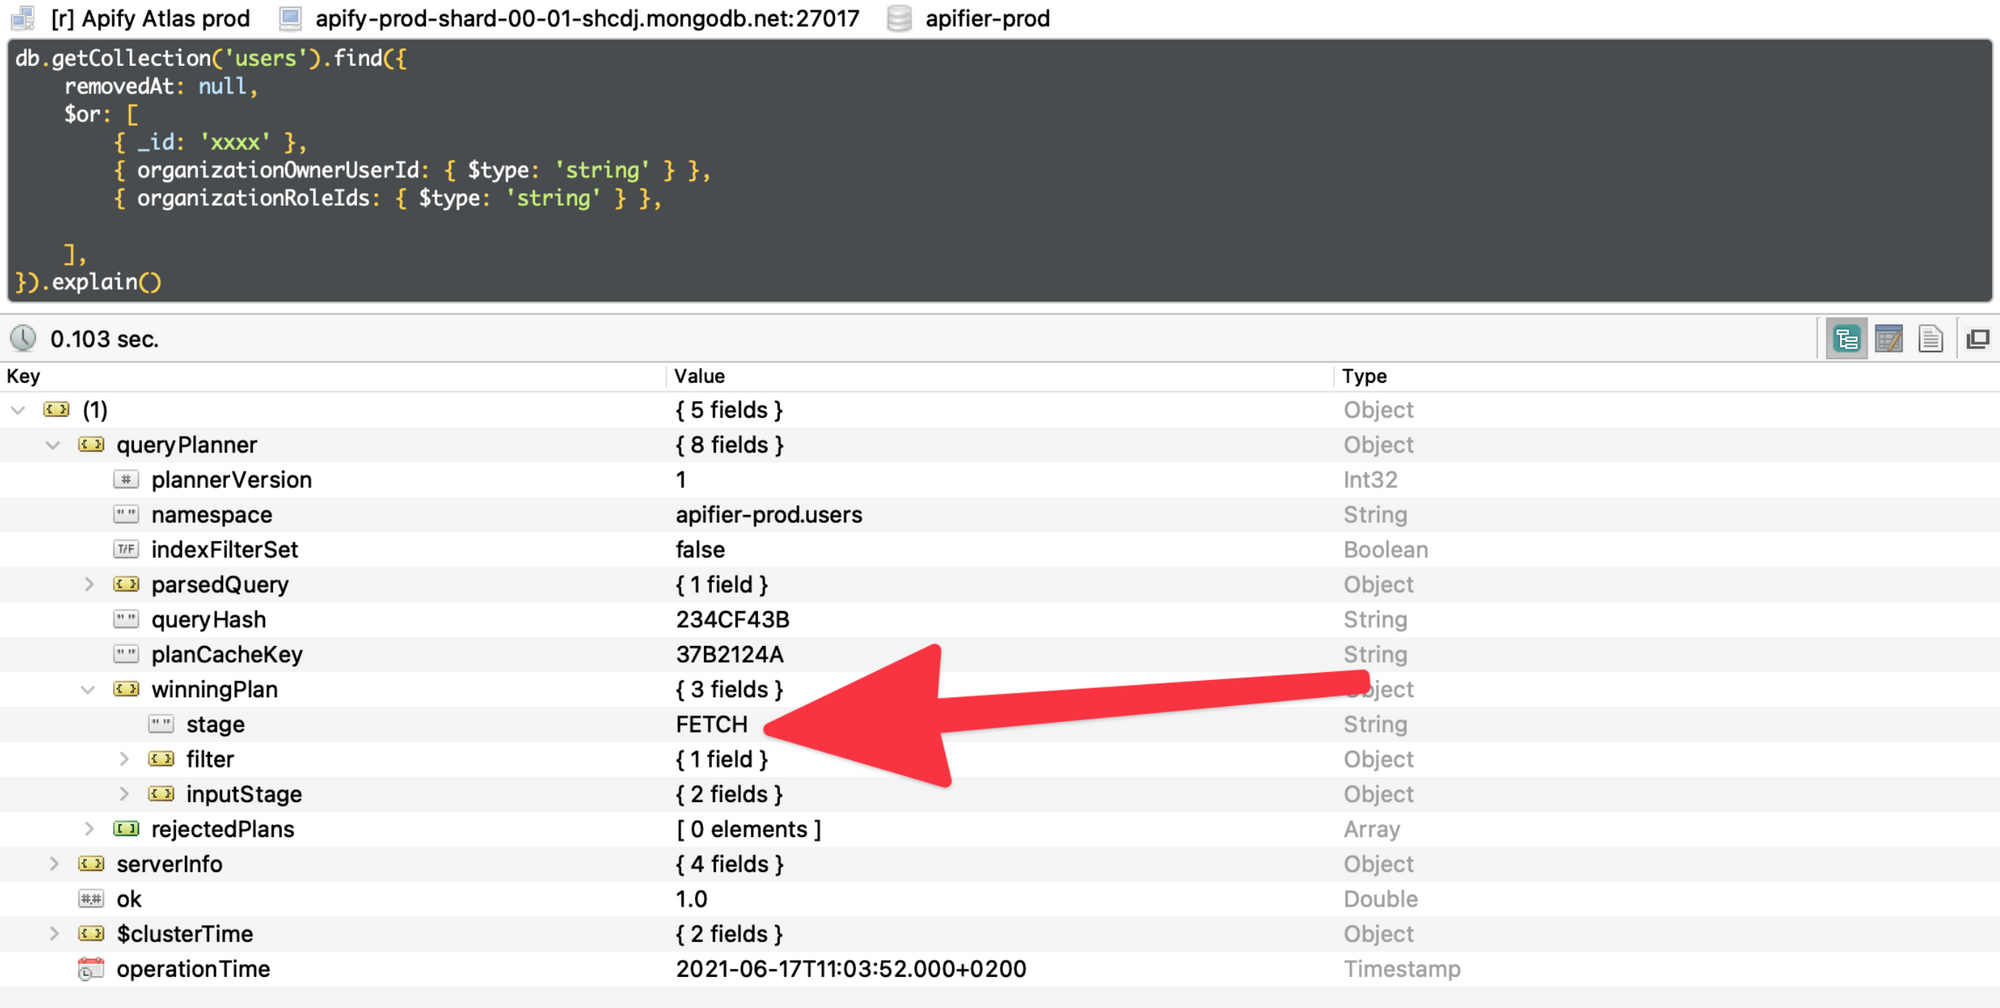
The query looked like it matches the index, so I opened Robo 3T to confirm. I used explain(), which provides information from the MongoDB query planner. This tells you which indexes, their combinations, or collection scan the MongoDB query planner considered to use, and what the winning plan is. The winning plan was COLLSCAN (scan of the whole collection) instead of FETCH (index fetch).
db.getCollection('users').find({
    removedAt: null,
    $or: [
        { _id: 'xxxx' },
        { organizationOwnerUserId: { $ne: null } },
        { organizationRoleIds: { $ne: null } },
    ],
}).explain().queryPlanner.winningPlan.stage
It turned out that the index for organizationOwnerUserId was sparse.
ensureIndex(
    Meteor.users,
    { organizationOwnerUserId: 1 },
    { sparse: true },
);
Such indexes cannot be used with the { $ne: null } filter, so I used { $type: 'string' } instead. It does the same for fields that are either null when empty or string.
You can find queries causing the highest network traffic or returning too many items as good candidates for optimization in a similar way.
Other MongoDB Atlas tools
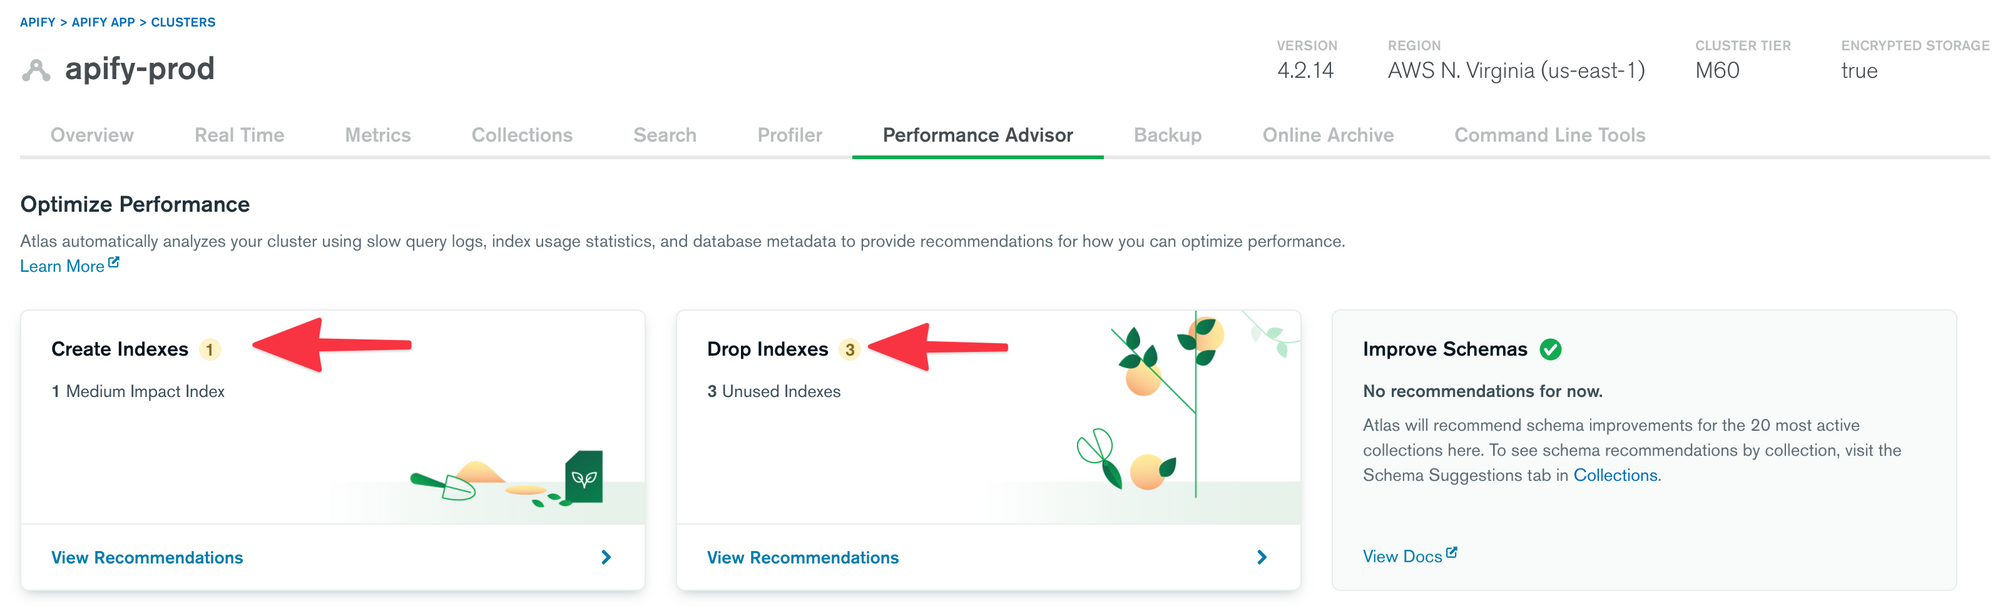
To capture queries not using the index or unused indexes, you can use the MongoDB Performance Advisor. I really like that its suggested changes are ranked by their impact score that reflects how often a query is called, warning you of over-optimization.
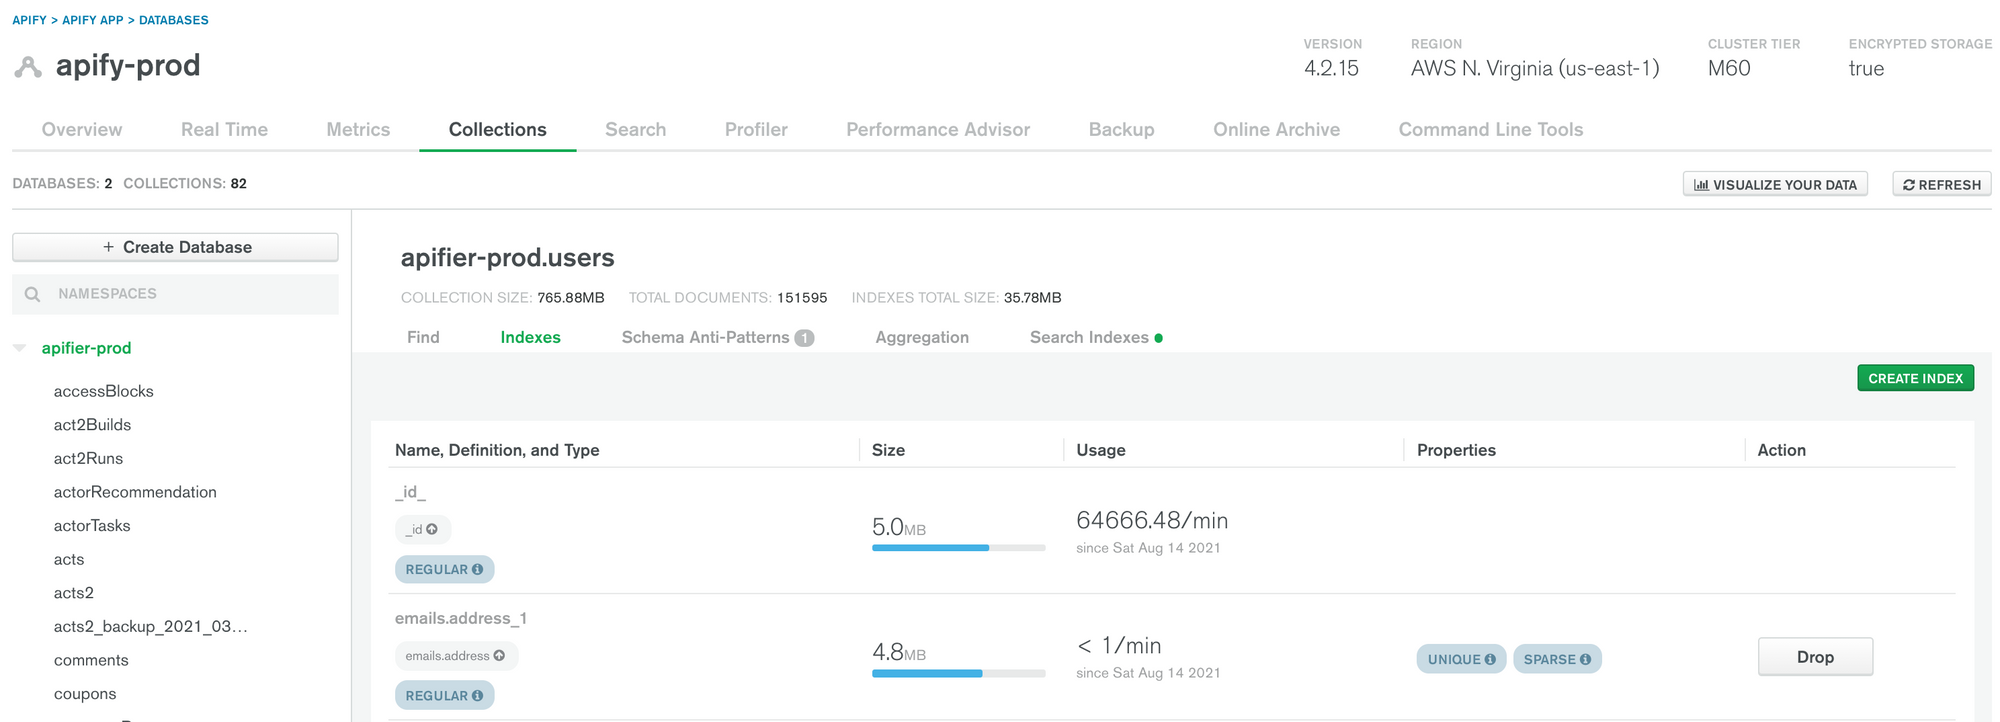
The handy tool for index optimization is hidden under the Collections tab. It contains information on how often each index is used, its size, and type. With this, you can identify barely used indexes and candidates for merging.
Reading from replicas
We have offloaded some heavy reads from our MongoDB primary instance to replicas. This includes mainly count() operations on large indexes, as these perform the b-tree index walk, which is heavy on disk input/output operations per second (IOPS). By performing these queries against replicas we protect our primary instance from IOPS peaks.
We didn't offload queries critical to system logic, since the content in replicas is inconsistent with the primary (due to replication lag).
 Kateřina Hroníková
Read on the everyday nitty-gritty of pager duty and postmortems.
Important metrics and alerting
What are the metrics to focus on? As usual, a good start is being minimal and building a culture of setting up alerts for metrics that proved themselves to be important in the past.
We have alerts set up for the CPU, disk utilization, and replication window, as those are critical for MongoDB's smooth operation.
- CPU and IOPS limits can be increased many times before you reach the maximum, at which point sharding remains the only way to scale higher.
- The replication window is given by Oplog (the protocol used to synchronize MongoDB replicas) data transfer and your disk size dedicated for Oplog history. If replication lag, possibly increased by high load, becomes longer than the replication window, the replica instance dies and will require a full re-sync with the primary MongoDB. We are trying to keep this value at 24h and more.
In addition to these critical alerts, we have low-severity ones for:
- Queries scanning more than 3k objects.
- Multiple concurrent queries running for a longer time.
- Index suggestions from the MongoDB Performance Advisor.
And finally, we keep an eye on network transfer, which is one of the largest items on our MongoDB invoice.
Conclusion
The optimization took us a couple of months, during which we improved our queries, indexes, and caching. In addition, we set up a complete alerting system with high-severity alerts delivered via Pager Duty alarms and low-severity alerts observable in real time via Slack. With this system in place, we can be sure that we will keep our database in good shape in the future.