Web scraping and browser automation are growing really fast, and observability is the key to keeping our platform stable and performant. At Apify, we recently changed a key observability component to a self-hosted one. Learn how we made the transition, what challenges we encountered, and what we learned along the way.
Our scale: The numbers behind Apify
Apify is a widely adopted cloud-based platform for web scraping and browser automation, with:
- 25,000+ active users
- 1.5M+ containers started daily
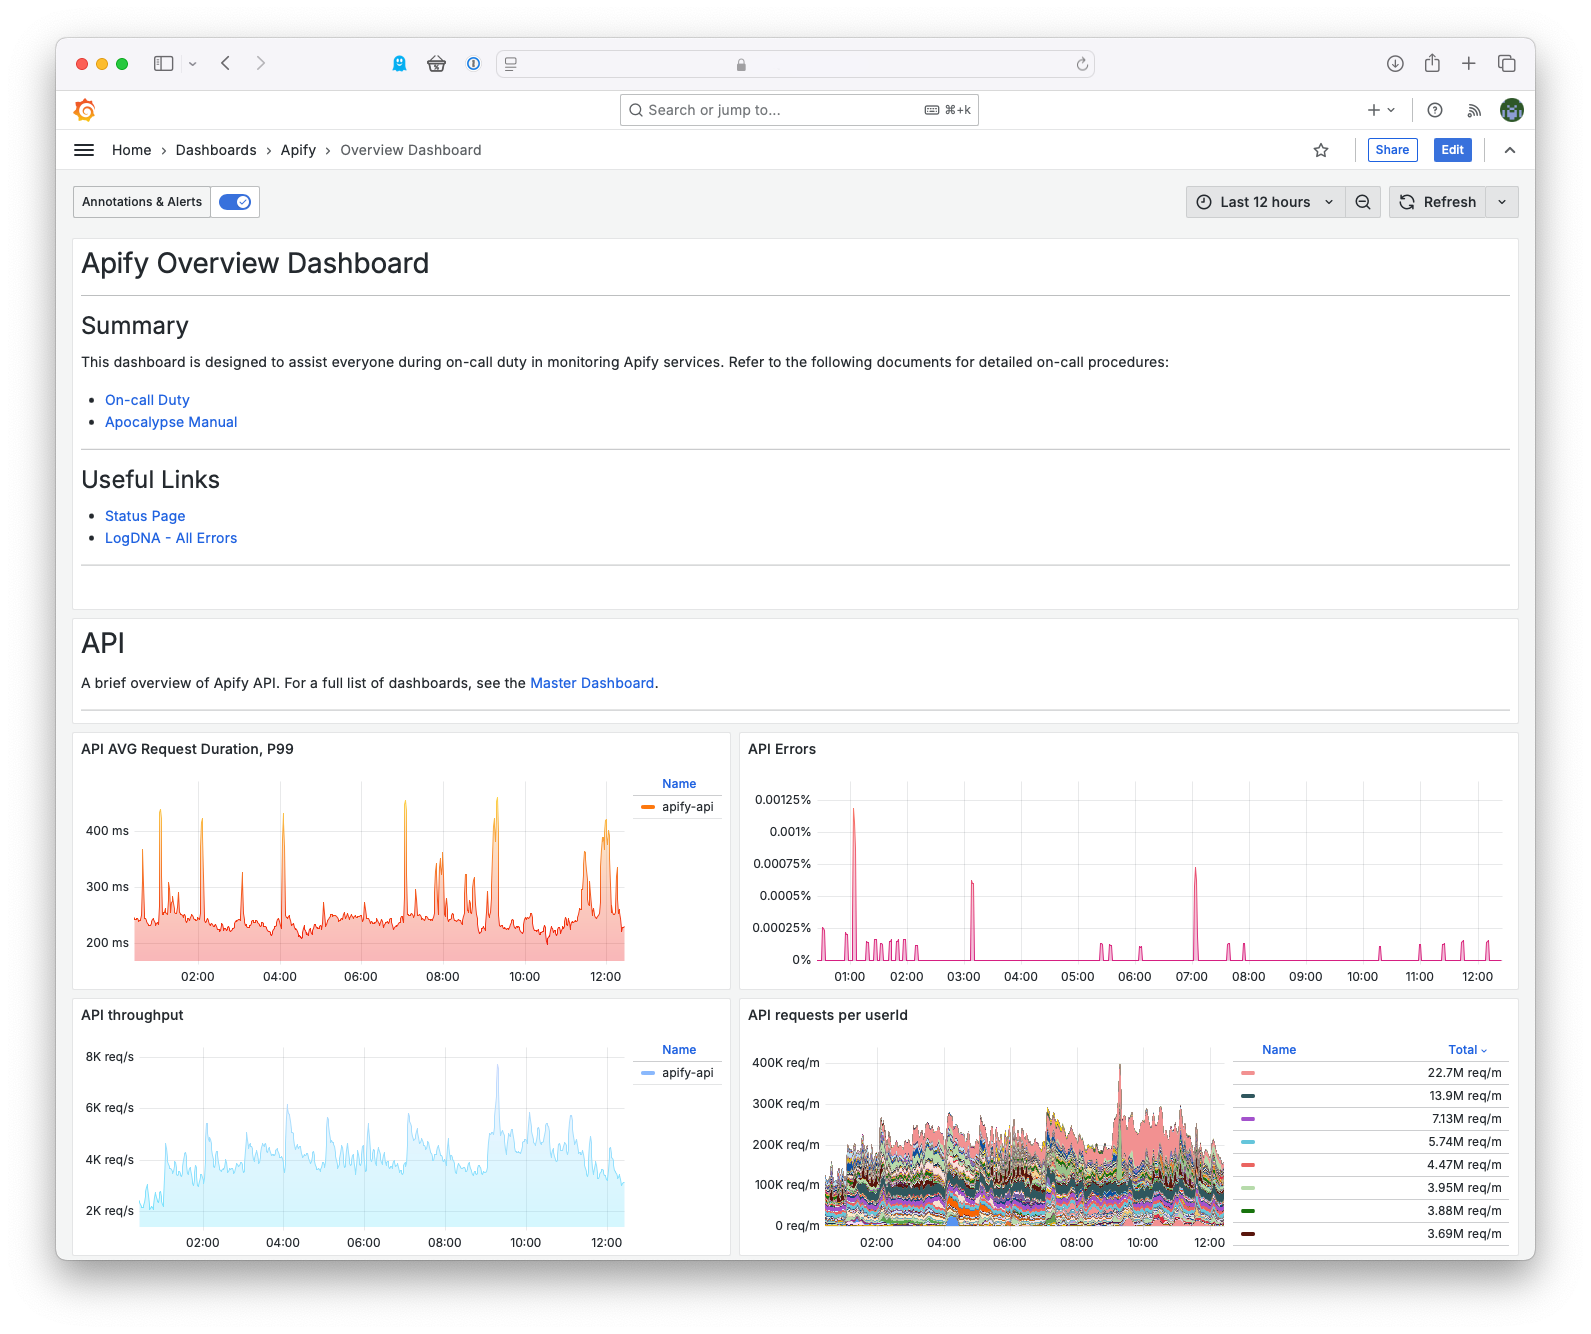
- Up to 8,000 API requests per second
The whole platform produces a large amount of monitoring data, which must be handled by the platform. Specifically:
- 130GB of logs across all components
- 4,000+ high cardinality metrics, which means 6–10 million active time series
Start manually, automate later ... and iterate
Our CTO Marek shared Apify’s observability story three years ago. He mentioned the “Start manually, automate later … and iterate” approach there. Now, it was time for the next iteration, and we looked at the New Relic infrastructure monitoring platform we started using in 2020.
At that time, it was a great starting point because it offered out-of-the-box simplicity with minimal setup - perfect for our initial observability needs. But as the platform grew, we faced some limitations.
- Not a perfect fit for us: As a company that supports open communities (we are building one around our platform), we prefer tools that are popular and widespread in these communities. Firstly, it makes any integration easier for us as there are plenty of ready-made solutions (dashboards, integrations), but it also gives us a better chance to hire good engineers for future growth.
- Data sampling: Sampling in New Relic made it harder for developers to debug accurately, especially during spikes.
- Developer frustrations: Poor UX, such as difficulties copying user IDs directly from dashboards, slowed down debugging. In addition, bugs and memory leaks in their SDKs caused degraded performance of the Apify platform.
- High costs: Changes in New Relic's pricing model, plus the growth of the Apify Platform over the past two years, have caused costs to increase significantly.
- No proper deployment. In the “start manually” times, we didn’t use IaC (Infrastructure as a Code) or GitOps techniques for configuration. We have to say that the problem wasn't NewRelic (it supports IaC) but the way we did it. Today, this means that any change to the monitoring platform is increasingly difficult to implement and monitor.
Making the switch to Grafana
Migrating to a new observability platform hasn't been without obstacles. We had to deal with several challenges:
- Starting from scratch: Moving away from the proprietary New Relic SDK required rewriting custom metrics to support the new platform. And since we’re making big changes anyway, we reviewed all metrics, alerts, and dashboards.
- Adoption for developers: Transitioning teams to a system with different workflows and interfaces required proper preparation.
- Scalability and cost balance: The load on our platform fluctuates, so the new monitoring platform had to effectively handle it.
After exploring various New Relic alternatives, we chose Grafana because of its popularity, strong community support, and open-source architecture. Initially, Grafana Cloud was considered (we prefer managed services!), but we quickly realized the associated costs ($60-80k/month at our scale) ☹️
Instead, we decided to self-host Grafana because we estimated it would cost 1/10 of the price. And it's always good to have that experience!
The Hub
We took the deployment of our monitoring platform seriously. To keep it secure and well organized, we set it up in a separate AWS account with its own infrastructure. This decision helped us keep things isolated and allowed us to better manage costs and access.
We wanted to get as close as possible to the Grafana Cloud architecture, which has been developed and refined over many years and its design is proven. And the large community that surrounds it is a big advantage - lots of open source dashboards and plugins are ready to use!
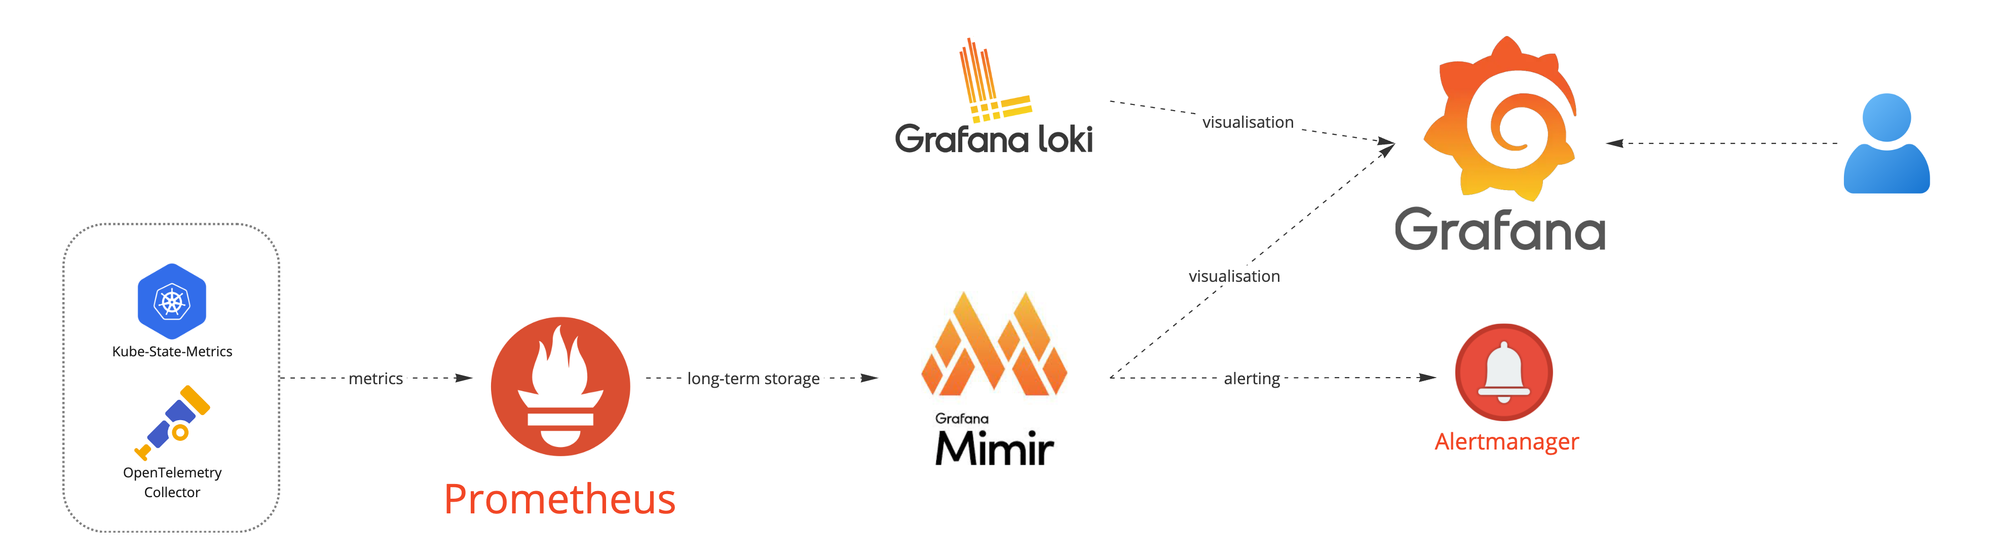
We stuck to the following components:
- Grafana for dashboards and visualization.
- Prometheus & AlertManager for record metrics and alert processing.
- Mimir as a long-term metric storage.
- Loki for providing logs and Kubernetes events from the platform itself.
- OpenTelemetry collector on the infrastructure side and SDK used in our Node.js applications for exporting custom metrics and traces.
Using GitHub, Terraform, and Terramate for the deployment makes sure that every change is consistent for all environments and is easily revertible.
We simply call our platform "The Hub".
The platform runs on an EKS cluster with approximately 40 nodes using around 1 TB of memory and 250 CPU cores in total. We used the ARM architecture whenever possible. As a result, 80% of our nodes are ARM-based nodes (Graviton instances).
For our developers with ❤️
The platform is designed for our developers for everyday use. We've made sure they have everything they need from the start - for example, complete documentation and ready-made dashboards to make the transition as easy as possible.
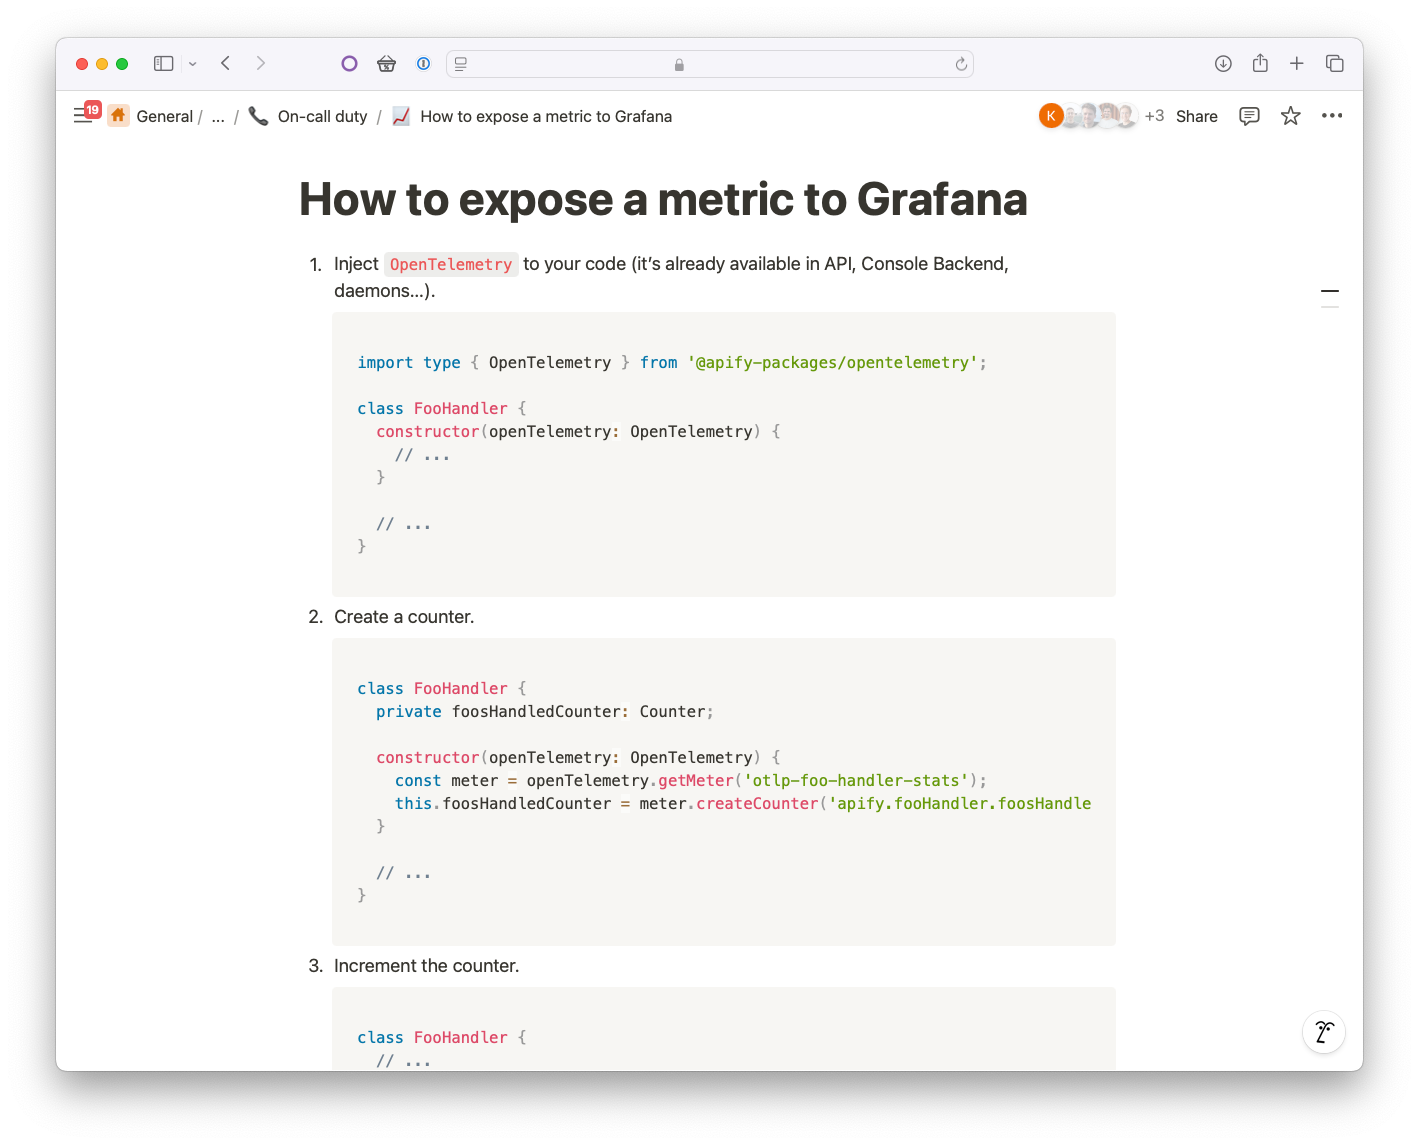
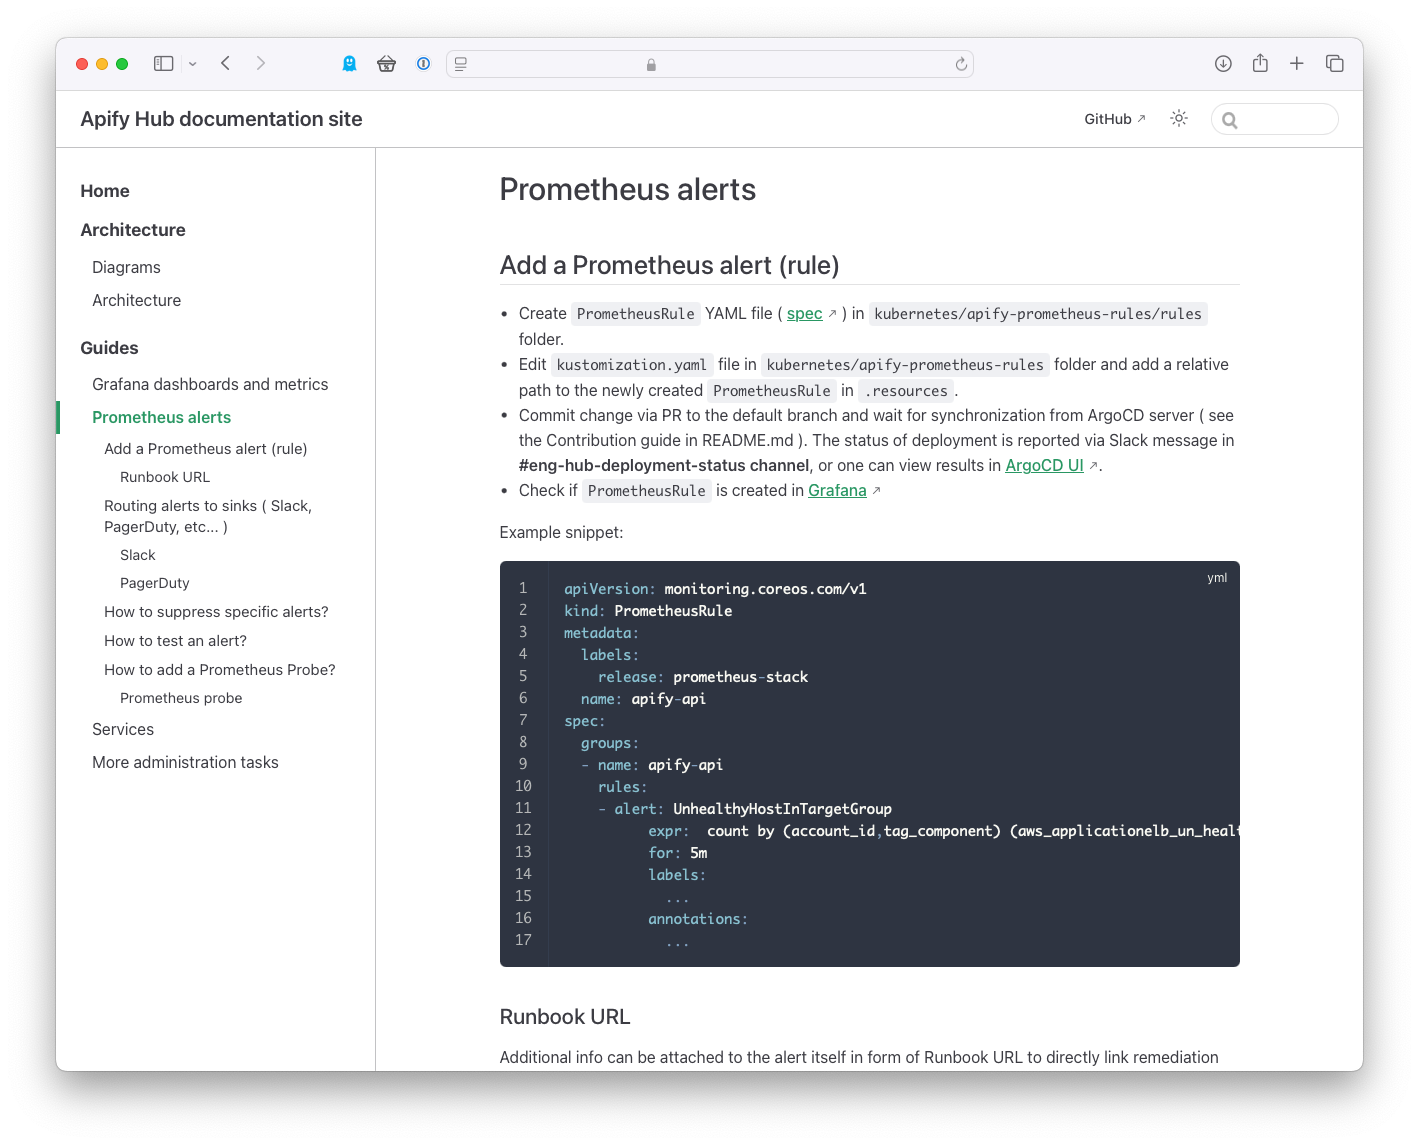
Our developers don't have to learn new things - thanks to GitHub Actions and ArgoCD in the backend, they can create custom alerts directly from their favorite IDE.
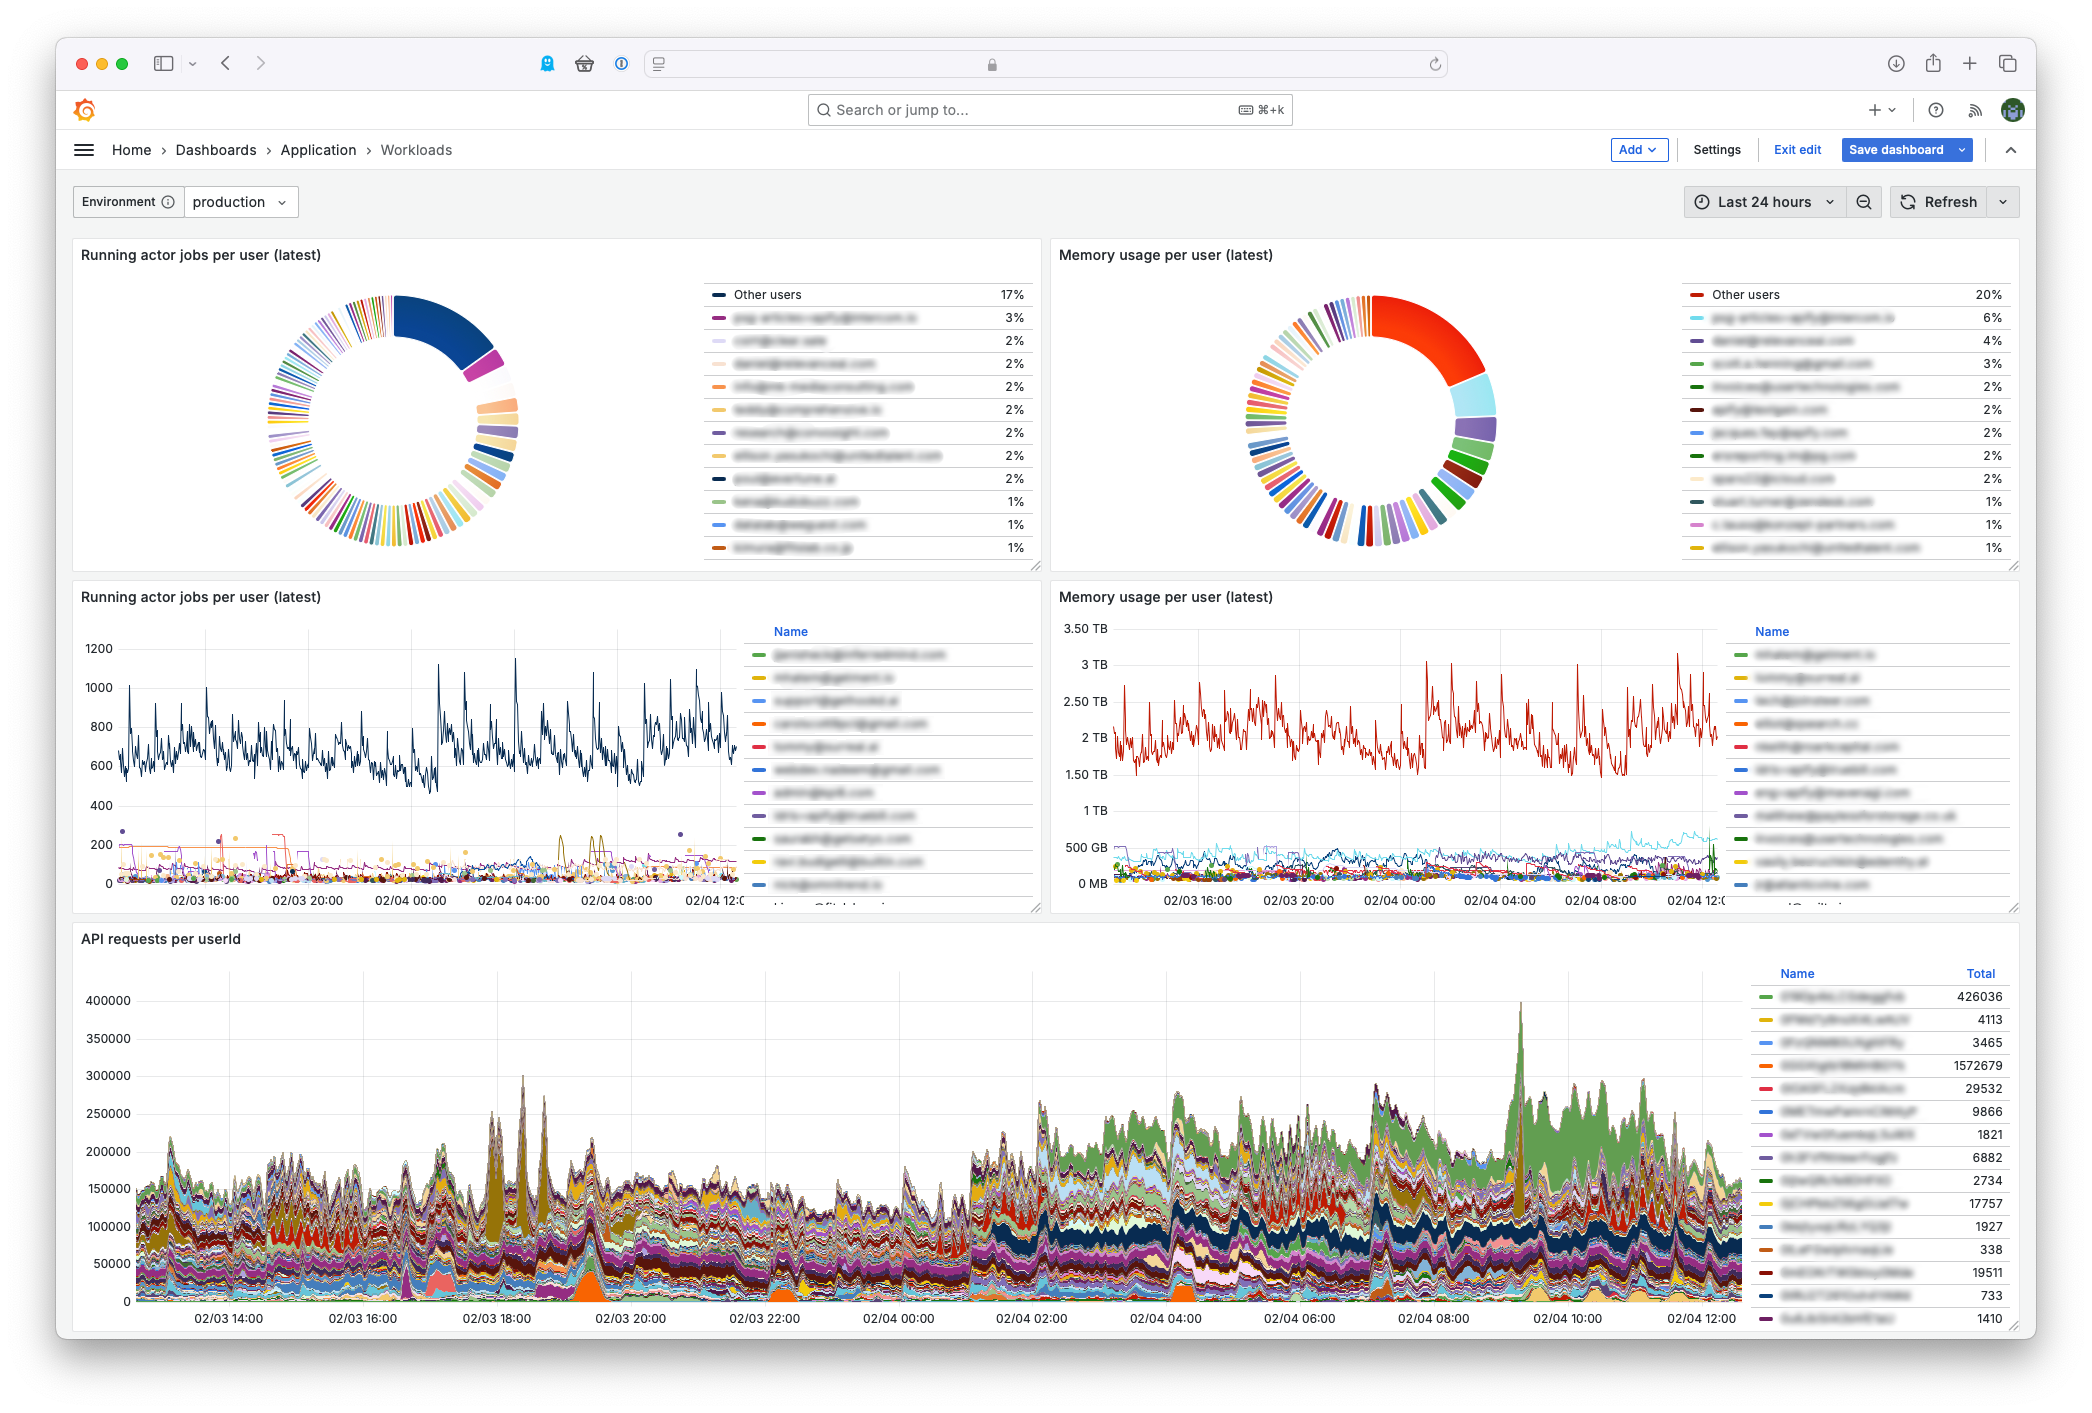
In addition to many pre-made dashboards, focused especially on AWS and Kubernetes, developers have created more than 80 dashboards that provide different and customized views of Apify platform components. There are also more than 100 alerts that inform about any anomalous platform behavior.
Not all rosy
In 2016, Amazon CTO Werner Vogels said, "You build it, you run it." That's what we did, and it's put us in a loop where we can improve the platform very quickly based on feedback from our developers. On the other hand, we now maintain two platforms instead of one. This additional workload sometimes diverts resources and focus away from core improvements.
We were also forced to compromise. We originally wanted to build a platform that could do everything, so we deployed Grafana Tempo for traces as well, but combined with deploying the platform in three availability zones, we easily went over budget. We then made a few adjustments:
- Moving to a single AZ (not overlapping with the Apify platform zones).
- Aggregation of traces into metrics within OpenTelemetry Collector, so we lose the details of individual traces.
These steps limit the observability platform's feature set slightly, but they keep our costs within budget.
The migration took more than 6 months. Unfortunately, due to the complexity of the project, the estimation was not done perfectly. It required a lot of communication with different teams to gather suggestions and feedback. In addition, we were often competing with other priority infrastructure projects, such as certifications and audits, which made planning even more difficult.
Takeaways for the future
We always try to self-reflect after a big project or changes we've made during development. Based on this, we define some points that could help us to do our work more efficiently in the future. The following points aren't new, but they're almost always true 😀
- Expect delays, always - Be prepared for longer migration times. A project that was supposed to take three months may stretch to six due to unexpected issues. Planning for potential delays will help you manage expectations and better allocate resources.
- Keep it simple - When migrating, stick to the core features first. This approach helps save money, reduce complexity, and keep the project on track. You can always add more features later without making the migration more difficult.
- Step by step - Try to break the migration into coherent parts that you can implement individually. After each part, validate it. Don't start too many things at once, you could get overwhelmed and stuck.