At Apify, we enable other companies and individuals to build innovative new products. Years ago, we started out as a simple web scraping tool where you log in, run your scrapers, and download the data. Now, we are an open web scraping and automation (RPA) platform on which hundreds of other businesses depend to run their day-to-day business, SaaS solutions, and various innovative products.
To get here, we had to build trust between our users and us. Over the past two years, we have invested a lot into monitoring and alerting, learned from our mistakes, and built processes to ensure that we handle incidents as openly as possible. In this article, I am going to describe our journey in terms of monitoring and alerting and give you an insight into what happens when, for example, AWS or DockerHub go down.
A brief history of our monitoring
In Apify's early history, there was no monitoring, so we had to manually keep an eye on individual servers. Our approach to monitoring (and everything else) was always: start manually, automate later, and iterate.
During our first year, we added centralized logging. We originally used Log Entries but later migrated to LogDNA. With centralized logging, we got one unified view of logs from our services, email alerting, and a daily digest of system errors.
The next step was infrastructure monitoring. We decided to integrate with New Relic Infrastructure. It gave us a great overview and alerting setup for our AWS EC2 instances, whose number was quickly growing.
The last, but not least, missing piece was PagerDuty, which makes sure that a team member will be alerted on high severity alerts. This was our basic setup and served us well for a while. Over time, though, the need for a more complex system became apparent as we were faced with many new challenges:
- Application-level performance monitoring for both our front-end UI and API and also various backend services
- Integration tests executed on a regular basis to ensure that the platform works end-to-end
- Alerts for databases, Kubernetes clusters, and other infrastructure components
- Distinction between low and high-severity alerting
- ...and more.
Current architecture
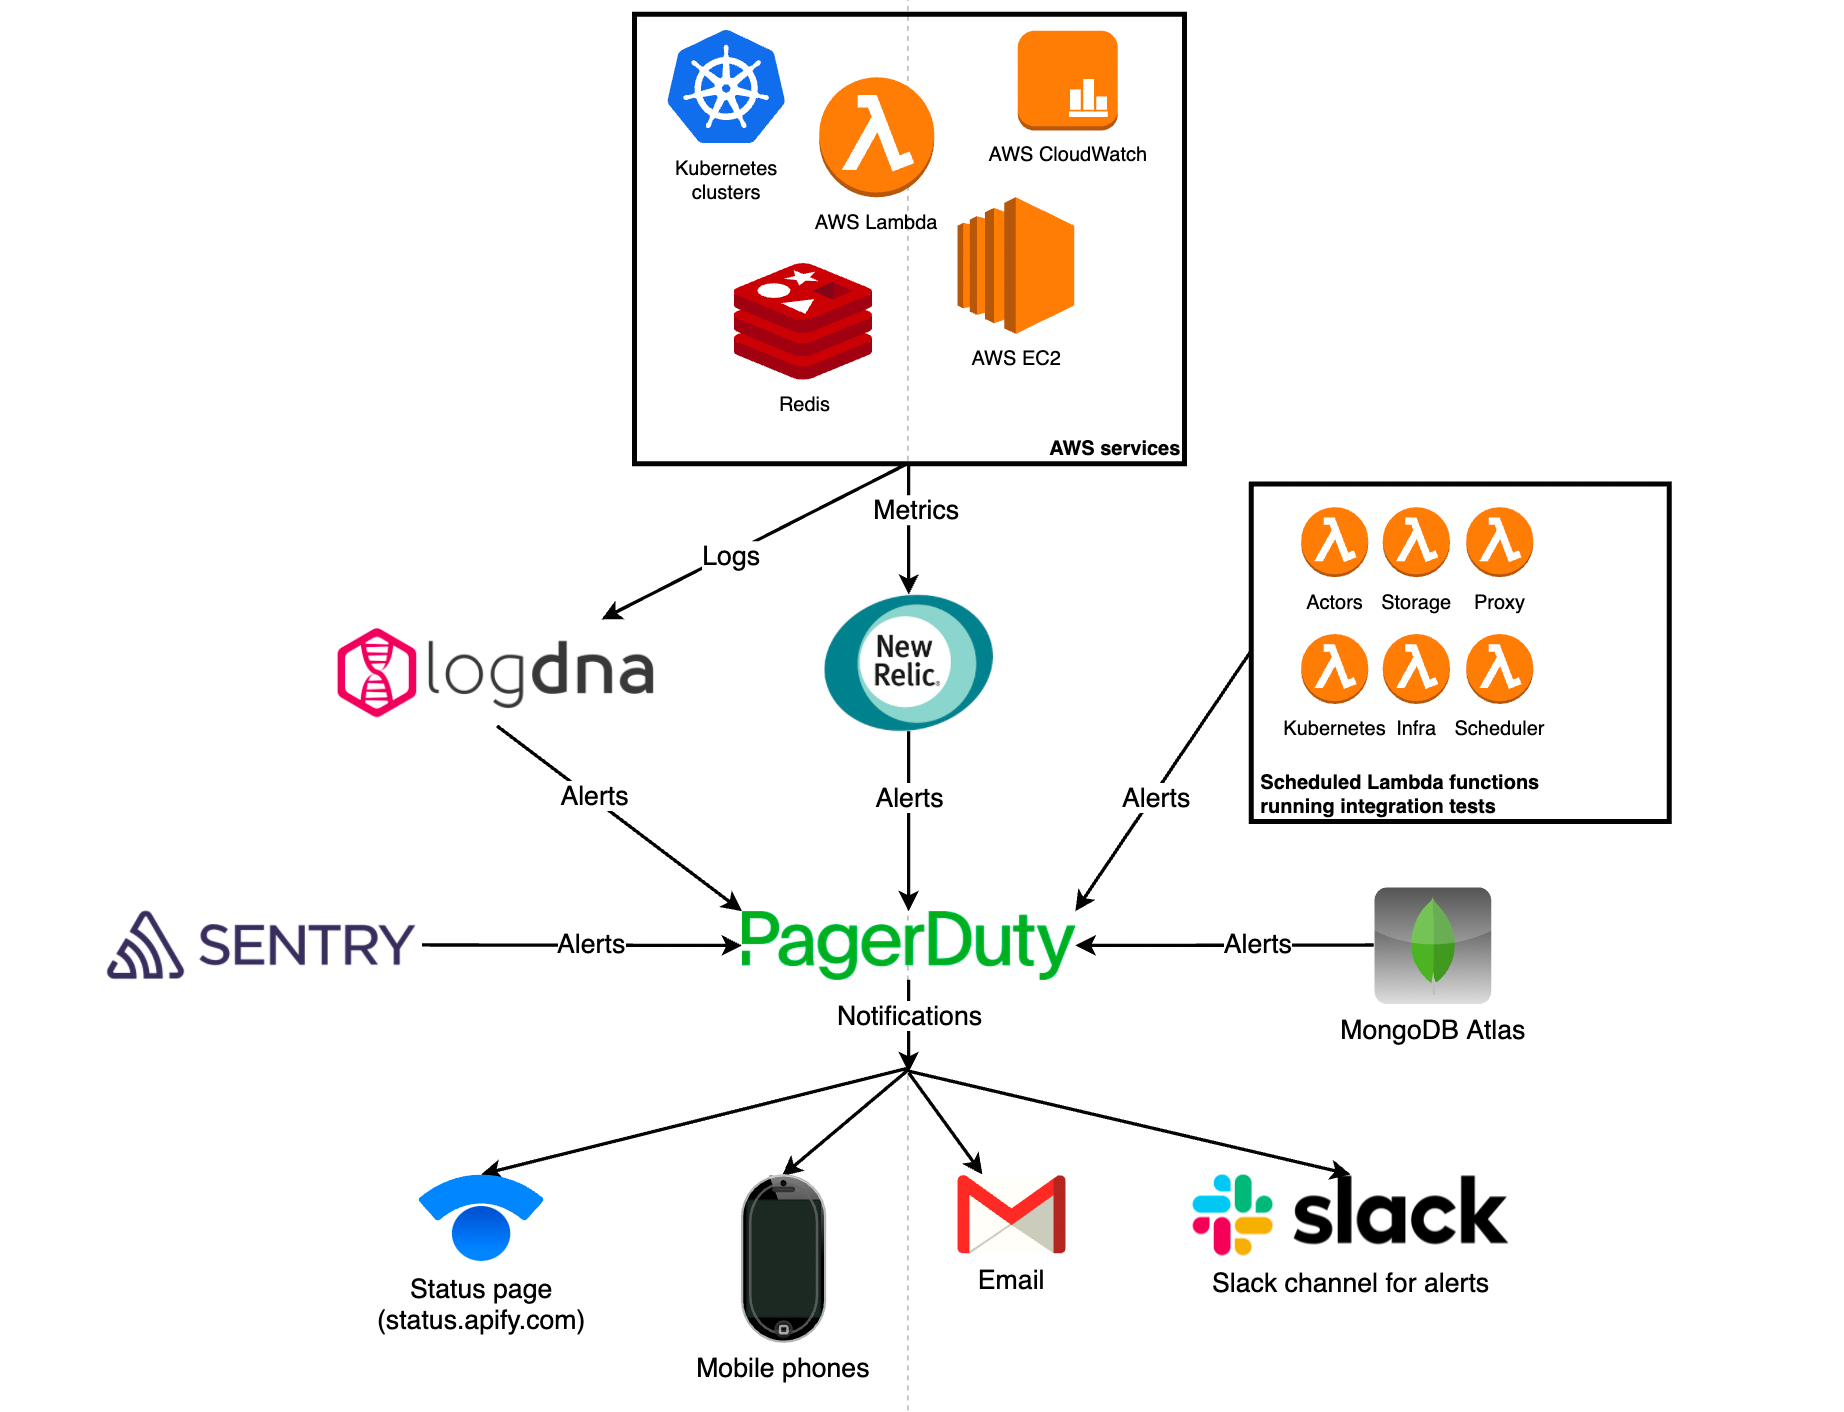
Our monitoring and alerting architecture are built around the following 4 services:
- New Relic - that's where we centralize our application and infrastructure metrics and configure all the metric-based alerting.
- LogDNA - here, we centralize our logs.
- Sentry - collects errors and metrics from our application's front-end.
- PagerDuty - used for centralizing alerts from the services above and other 3rd-party systems such as MongoDB Atlas (our database provider). Based on the severity of the alert and affected component, PagerDuty notifies our team via multiple channels and also updates our main communication channel with our user base–the Apify status page.
In addition to this, we have a battery of AWS Lambda functions that run integration tests against all Apify platform components on a 5-minute schedule. If a test fails, an alert is sent to PagerDuty, which notifies our team and updates the status page.
We distinguish between 2 types of alerts:
- ⚠️ High severity - means, or may potentially lead to, a partial system outage. We handle this type of alert 24/7.
- 💡Low severity - minor performance drops, sub-optimal queries, etc., without immediate or with only a short-term effect on the system. These alerts do not require immediate action from the team.
Below are examples of the types of alerts we have on each system level, from raw infrastructure, through the Kubernetes cluster, and up to application-level.
| Components | Example alerts |
|---|---|
| Infrastructure (EC2, ...) |
- Cannot launch a new instance |
| Kubernetes clusters | - Deployment scaled to maximum - Increased number of pod restarts |
| Databases (MongoDB, Redis) |
- CPU, memory, disk utilization, ... - Index suggestions, sub-optimal queries, ... |
| Application-level (Apify Console, Website, APIs, Proxies, ...) |
- Apdex (application performance index) drop - Increased error rate |
Going deeper into metrics
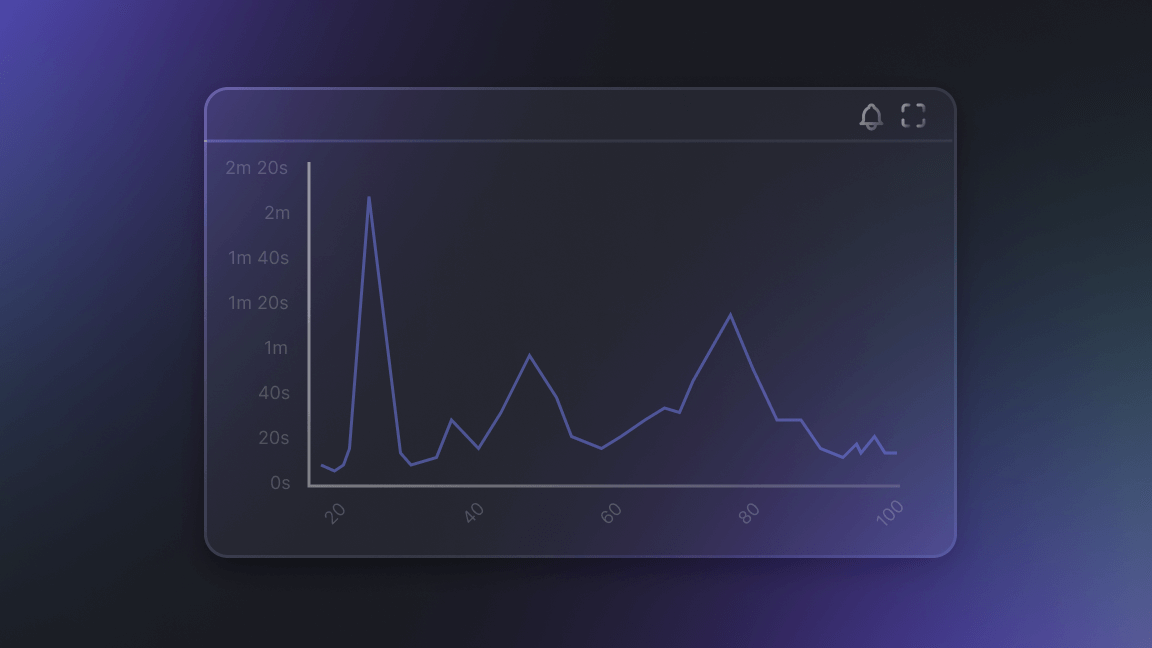
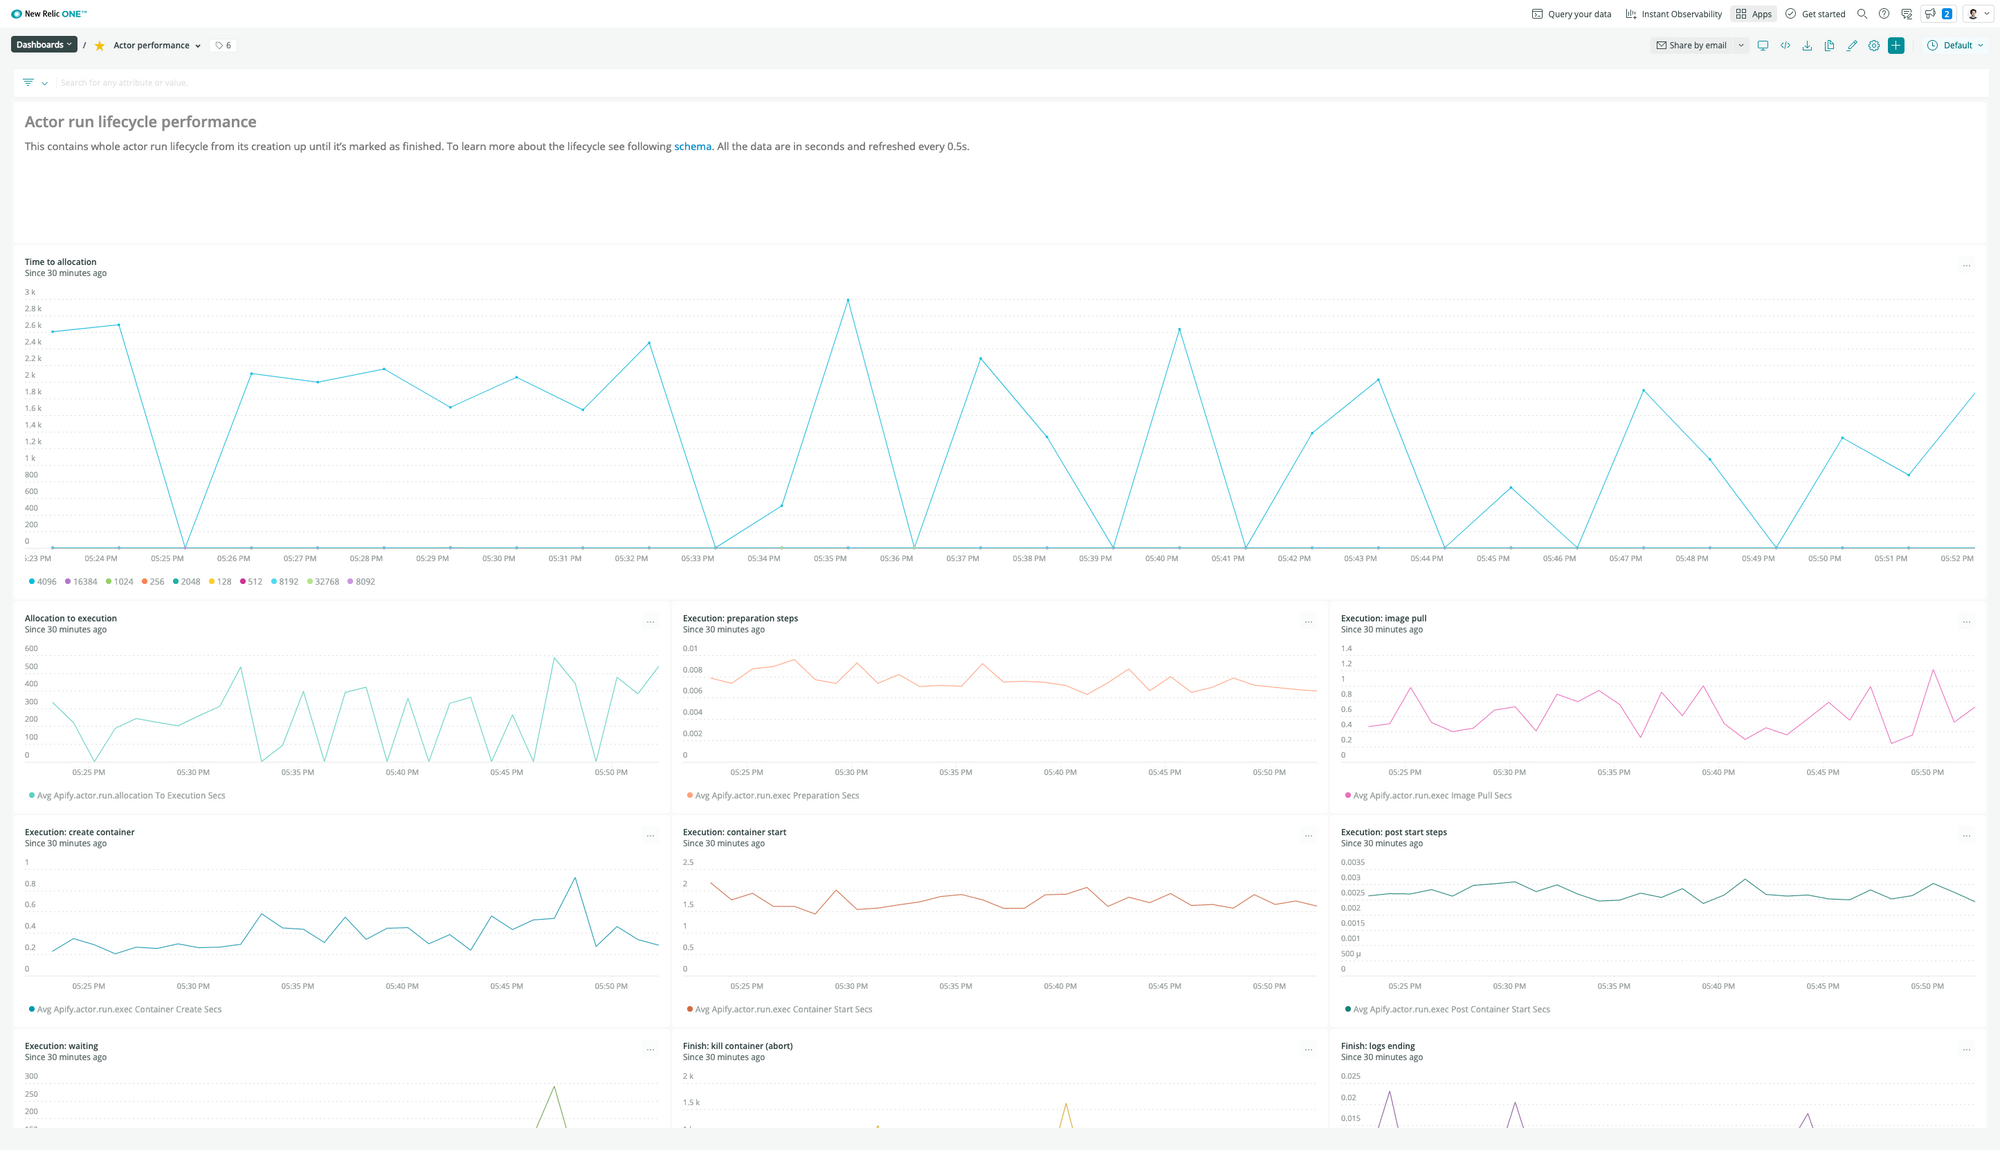
To get deeper insights into performance and overall system health, we started collecting custom application and infrastructure metrics using the New Relic Telemetry Data Platform, to which we send aggregated data from all our system components. For example, see the following dashboard to see a breakdown of how the runtime for Apify Actors performs:
On-call and postmortems
Alerting goes hand-in-hand with the on-call process. In the event of a high-severity alert, the on-duty teammate gets notified (or woken up 😱) to handle the alert. For this, we use a PagerDuty schedule that rotates 10 people on a 3-day basis with a 2nd-level backup in case the on-duty person is temporarily offline.
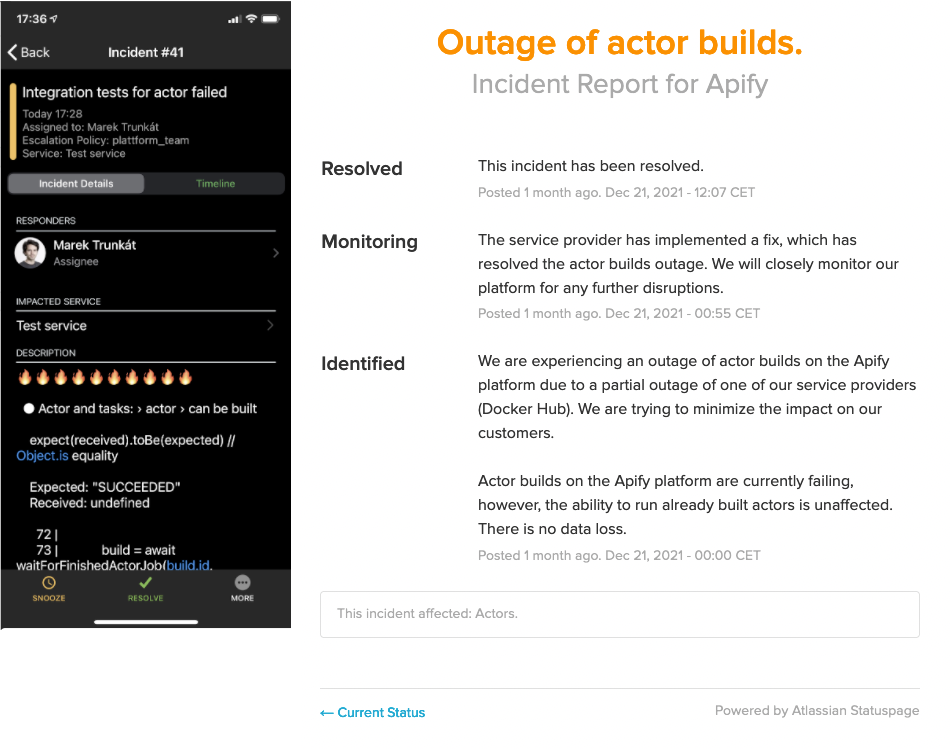
In case of high-severity alerts, which mean that some system components are likely to be affected, we always follow these steps:
- Analysis of the situation and impact on our users.
- Communication of the incident via the status page to keep users informed during the whole incident.
- Incident handling.
- Postmortem to learn from our mistakes.
We write a postmortem for every important incident to learn from our mistakes, make the system more resilient, and preserve our learning material and knowledge for future hires. If it happens that we don't find the failure's root cause during the postmortem, we at least define new metrics or alerts that will give us more time if the incident occurs again.
You can read more about postmortem culture from Google and PagerDuty. From Atlassian's "the importance of an incident postmortem process":
Incidents happen.
They just do. As our systems grow in scale and complexity, failures are inevitable.
Incidents are also a learning opportunity.
A chance to uncover vulnerabilities in your system. An opportunity to mitigate repeat incidents and decrease time to resolution. A time to bring your teams together and plan for how they can be even better next time.
The best way to work through what happened during an incident and capture any lessons learned is by conducting an incident post-mortem, also known as a post-incident review.
Lessons learned
- Making sure everyone's mobile phone is correctly set up. Otherwise, for example, iOS's "Do Not Disturb" mode won't let PagerDuty wake you up 🙂. Read more about this in the PagerDuty docs.
- It's way too easy to configure too many alerts that will ring all the time. This always results in people ignoring them and it takes time to revert this behavior back to proactive management. Therefore, it's better to be careful with this and set up a minimal set of alerts. Then, you can increase the number over time (based on postmortems).
- The right on-call schedule is important, as people lose touch with the process when they don't have it frequently enough. On the other hand, having on-call too frequently affects the velocity of each team, as during on-call we don't do normal day-to-day product work.
- Write postmortem notes right after the incident or, even better, during the incident - it serves very well as the shared knowledge base during the incident management. It's very easy to miss something important later on.
Summary
We architectured our monitoring and alerting system iteratively from a very minimal setup up to the current state, where we can observe all of our platform's layers, from the infrastructure up to application-level, and especially the front-end layer. Thanks to this setup, it is easy to add a new metric or integration test, connect it to our status page, and notify the team of any incidents.
All of this helps to build trust in our service and make sure that Apify remains up and running all day every day for our users.


