If you use Actors on Apify regularly, you'll probably reach a point where running an Actor manually through Apify Console is no longer scalable, and you'll look for ways to automate this process.
To do that, you can use the Scheduler, integration platforms like Make.com or Zapier, or you can start the Actor through the API from some other system. The choice is yours.
With the Actors running automatically, it’s very easy to just let them run and forget about them, but sadly that almost never ends well. Actors usually interact with other 3rd party systems, and those systems can change. When they change, the Actor can break.
So if you want to have your Actors running automatically and at the same time do not want to manually monitor them, you also need automated monitoring.
What is Actor run monitoring?
When you run an Actor, Apify gathers run metrics. These can be simple things like the current run status or how many items are in the dataset, or more complicated metrics like how much proxy traffic the run uses or how much memory or CPU the run is using.
You can then view these gathered metrics in Apify Console. This way, you can look at the past runs of your Actor and see if there are any outliers, which could indicate an issue.
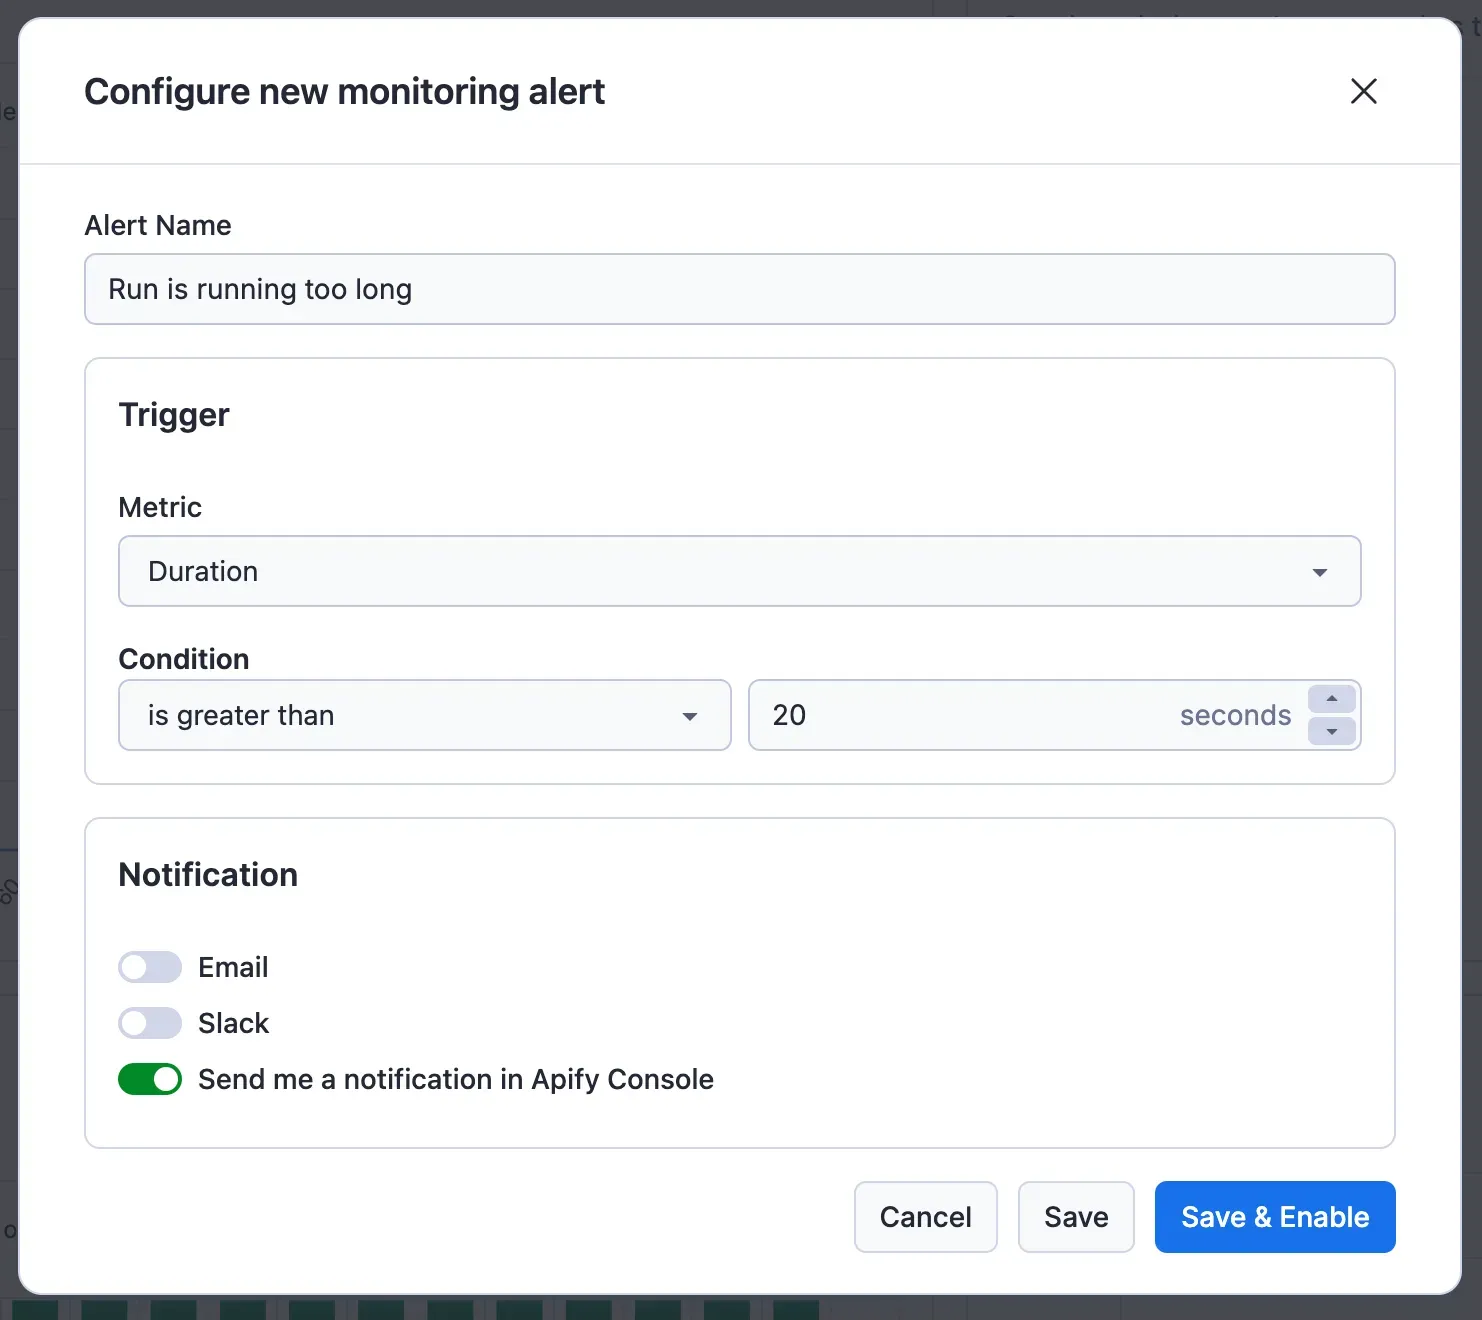
But just looking at charts isn't automated; for that, we have alerts. You can also set an alert for any of the metrics we aggregate and display as a chart. Then, if a run with monitoring enabled triggers the alert, you'll receive a message about it. You can choose from an app notification, email, or Slack message.
How does it work?
When you start your Actor, we start two systems internally: the Run metrics collector and the Run metrics monitor.
Run metrics collector
The collector processes the current run status, and increments run metrics every few seconds.
The collected metrics are:
- Number of results
- Run duration
- Cost/Usage (in $)
- Compute Units
- Dataset metrics
- Reads
- Writes
- Max number of fields in dataset items
- Key-Value store metrics
- Reads
- Writes
- List operations
- Request queue metrics
- Total number of requests
- Number of handled requests
- Reads
- Writes
- Max CPU and Memory usage
- Data transfer - internal and external
- Proxy usage
- Residential proxy data transfer
- SERP proxy requests
- Dataset validation metrics per field (if validation is set up)
- Minimum and maximum value
- How many rows have the field empty/null
Run metrics monitor
The monitor periodically checks the run metrics every few minutes and compares them with the alert triggers you have set up for the Actor.
There are two different trigger condition types:
- Value of metric
is less thanthe condition value - Value of metric
is greater thanthe condition value
These conditions are evaluated differently.
While the run is in process, the monitor only evaluates the second condition (is greater than), the reason for this is that the run metrics always start at 0 and increase during the run, so the first condition would trigger immediately when the run starts.
After the run finishes, the monitor does one last check, during which it evaluates both condition types since the metrics should not change anymore.
What can you do with it?
As mentioned above, the most common use case for monitoring is to ensure that your solutions are working as expected. The simplest way to set up monitoring like this is to evaluate how your Actor behaves and then set up monitoring around it.
The second reason you might have for monitoring is not to monitor the health of your solution but to monitor the solution for some expected outcome, this is usually based on monitoring data in a dataset (either total item count or specific field metrics).
Simple use case: Slow queries in MongoDB logs Actor
A few months back, we had an issue that there were some slow queries to our production database, causing a slowdown of the whole system. We fixed the slow queries and to prevent this from happening again in the future, we developed an Actor, which monitors the database periodically.
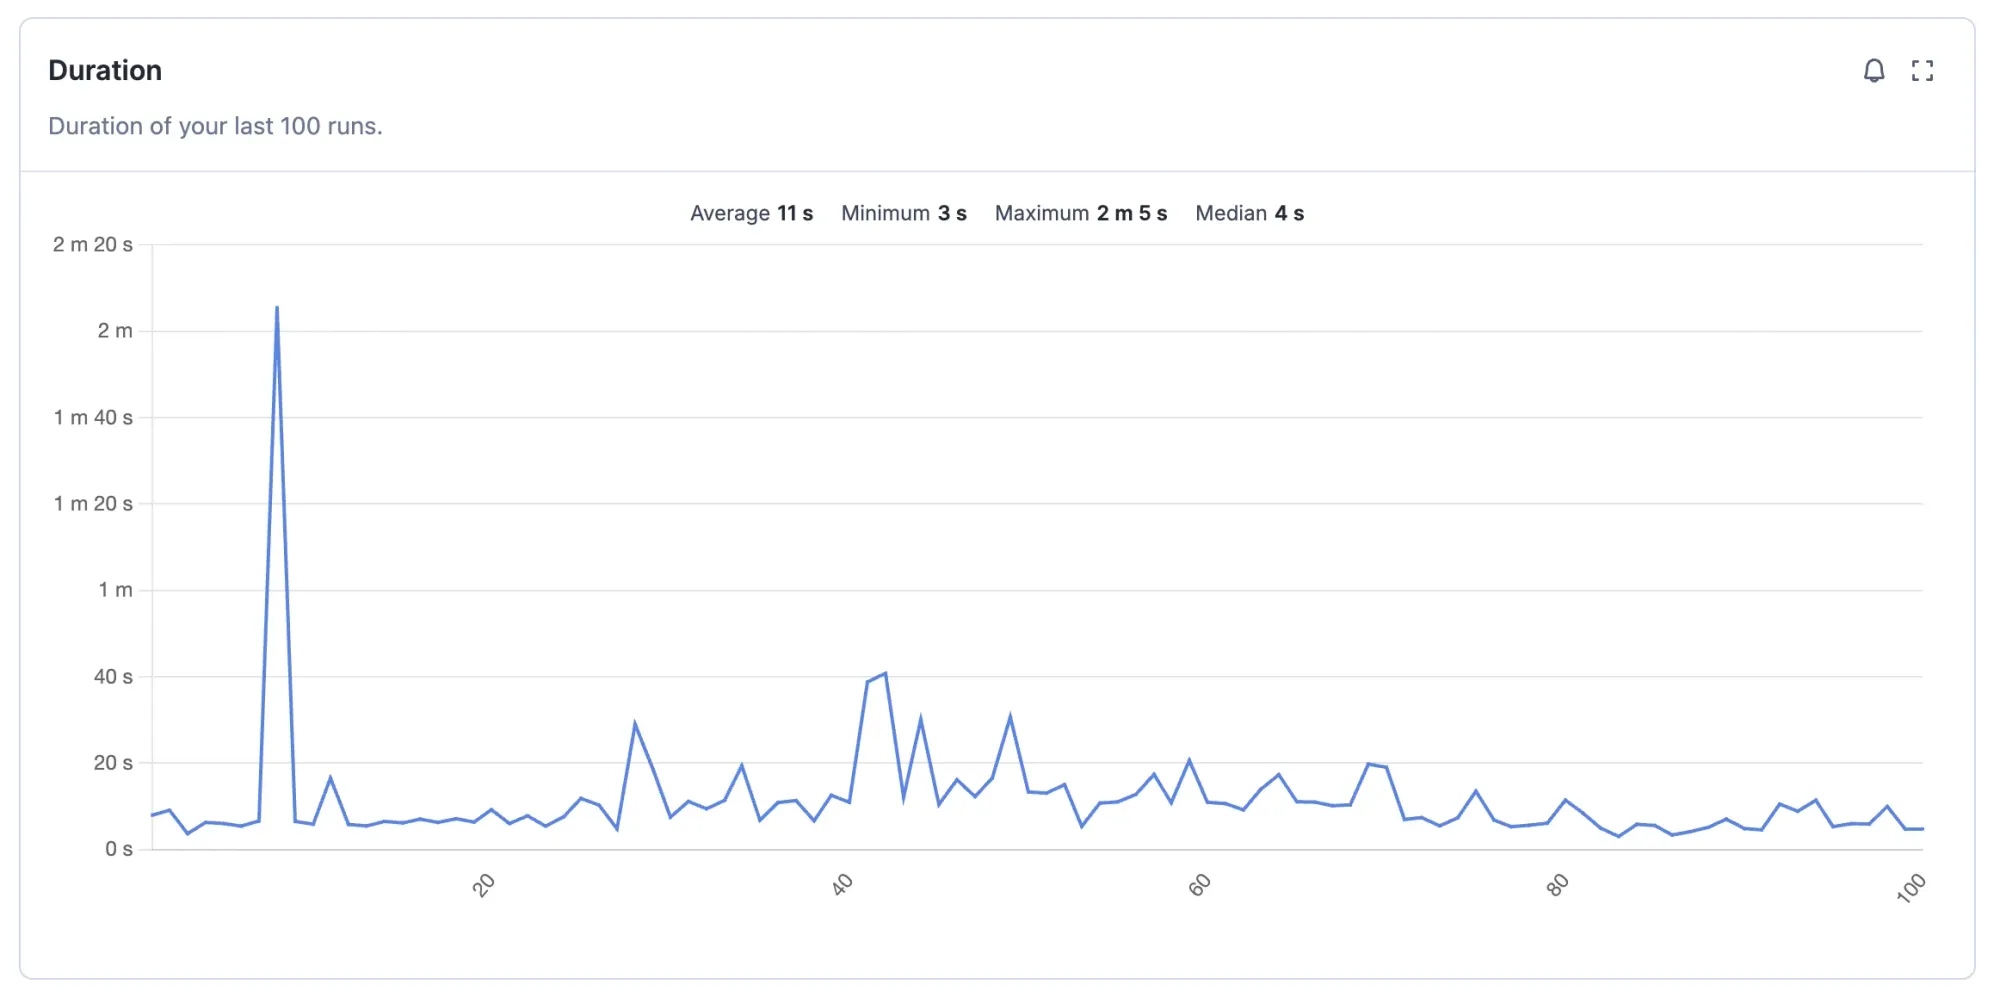
The solution runs periodically every hour and these are the metrics we see when we check the metrics tab in the UI:
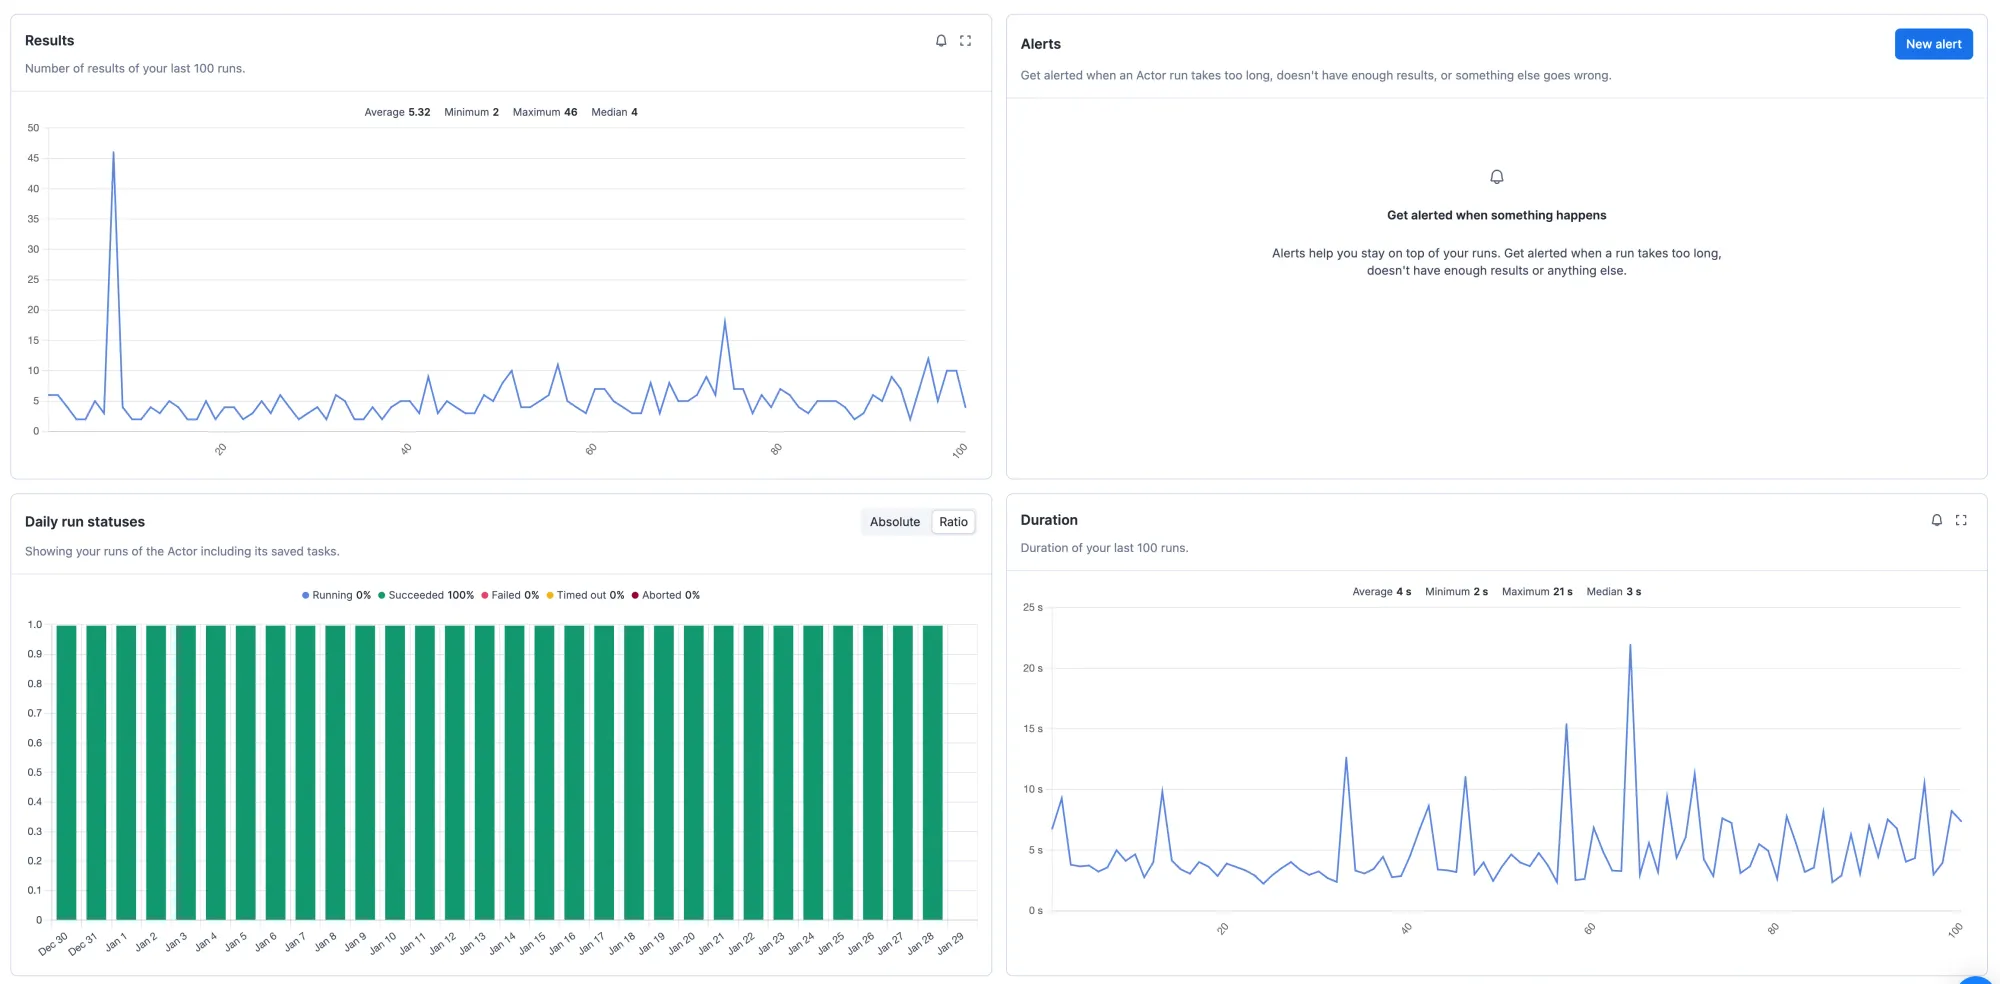
Looking at these charts, there are some fairly obvious things we can monitor to ensure that everything works well. We need to be alerted when:
- Run status is anything else than succeeded
- The duration of the run
is greater than30 seconds
If we look at the number of results, we can even set up monitoring which warns us if something bad is happening to our database:
- The number of results
is greater than20
With these 3 monitoring alerts, we'll know when the Actor failed or behaved unexpectedly, and we'll also be alerted if there were more slow queries than expected during the last hour.
Advanced use case: Plane tickets tracker
If the Actor you're using has a dataset validation schema defined, you can set up monitoring on the specific fields from the results. This can be very useful if you're waiting for something very specific to happen in the data you are scraping.
To illustrate this example, I'll use an Actor I created for myself a year ago when looking for plane tickets for my vacation in Japan. We didn't have monitoring at the time, and I had to write multiple Actors to solve my use case.
I had an Actor which found flight tickets based on my search query from Skyscanner and I had this need:
- I knew when I wanted to go to Japan
- I knew the general price I was willing to pay
- I wanted to be notified when a flight appeared matching my requirements
- I wanted to know right away if there was a ticket that matched my ideal scenario (a short, cheap flight on Monday)
To solve this, I could have created the following schema for my dataset:
{
  "$schema": "http://json-schema.org/draft-07/schema#",
  "type": "object",
  "properties": {
        "price": {
            "type": "number"
        },
        "flightThereDepartureAt": {
            "type": "string"
        },
        "flightThereDurationHours": {
            "type": "number"
        },
        "flightBackArrivalAt": {
            "type": "string"
        },
        "flightBackDurationHours": {
            "type": "number"
        },
        "isIdeal": {
            "type": "boolean"
        }
  },
    "additionalProperties": true,
  "required": ["price", "flightThereDurationHours", "flightBackDurationHours"]
}
And in the code of my Actor, I could have added the following code to calculate my ideal scenario:
// Ideal trip is cheaper than 18000CZK for return ticket, lasts less that 15 hours on both flights
// and we depart on saturday and return on sunday
const isIdeal = price < 18000
    && flightThereDurationHours < 15
    && flightBackDurationHours < 15
    && flightThereDepartureDay === 6
    && flightBackArrivalDay === 7;
With these two things handled, I could have easily added the following monitoring alerts:
- Send me a Slack notification if a run fails
- Email me when the dataset contains an item where the minimum of a field
priceis less thanmy limit - Send me a Slack notification when there is a flight where the field
isIdealhas a maximum value of1(meaning true)
With these 3 notifications, I would learn right away if my run failed for any reason. I would get an email that I could check at my leisure when there was a flight below my price limit, and I would also get a Slack notification right away if there was a flight that was ideal for me.
Sadly, when I was looking for flight tickets, this was not implemented yet, so I had multiple Actors process the dataset and then trigger other email/Slack notification solutions based on my conditions. Happily, that's no longer the case!