What makes a city enjoyable to live in? According to Carlos Moreno, to really enjoy a city, one must be able to live within 15 minutes walking, biking, or public transit distance of everything one needs to eat, drink, work, and play.
Discover how one curious writer uses scraped map data to apply Moreno’s concept to define where within his city such a 15-minute city exists, and where it might be created.
🤔 What is a 15-minute city?
The "15-minute city" is an urban design strategy aimed at enhancing the quality of city life. The model envisions cities where work, education, shopping, healthcare, and leisure are all within a 15-minute walk or bike ride from home. Instead of long commutes, the 15-minute city promotes sustainable, active, and cohesive neighborhoods. As a strategy, it's been globally endorsed by several city mayors, most notably Paris's Anne Hidalgo. The concept gained popularity, particularly during the COVID-19 pandemic, due to its potential in reducing carbon footprints and promoting healthier lifestyles.
Robert Turner is a technology lead with a Ph.D. in government and a passion for public things, including cities and urban planning. After spending two years in Budapest, Robert had transplanted to Nanaimo, a small western Canadian city, where he came across an article reporting that city officials were interested in making Nanaimo a “15-minute city”.
That the sprawling, car-dependent City of Nanaimo was touting the idea piqued Robert’s attention. He wondered if one could quantitatively evaluate how close or far a city is from approximating Moreno’s model. It seemed obvious that a city with Walk, Bike, and Public Transit Scores in the mid-30s could not possibly be a 15-minute city overall. But what about certain city districts? Were some neighborhoods more car-dependent than others? And if they were, could this be changed? All good questions with no clear answers. Research and data were necessary.
💡 Mapping out project ideas
Having no prior experience with mapping, Robert ran his thoughts by a few friends from grad school. They suggested working backwards from zones around amenity locations – grocery markets, pharmacies, parks, schools, and so on – to find areas of intersection. These overlapping amenity-access zones would be 15-minute neighborhoods.
Having surveyed some of the 15-minute city literature, Robert observed two trends: there were, on the one hand, very sophisticated analyses, mostly of very large, cosmopolitan cities, and on the other, more aesthetically appealing visions of the 15-minute city with very little quantitative substance. Cities like Nanaimo generally fell outside the gaze of more cosmopolitan urban planners. Robert decided to take a very basic, broad approach that would lay the ground for an informed, local, public discussion of 15-minute walkability.
La ville du quart d’heure en images. Credit: Micaël.
If, for example, the city wanted to encourage 15-minute walkability by changing zoning laws or urban planning policy, it would be helpful to have a quantified picture of where walkability is feasible and where it is not.
The challenge, in the end, was to create something both quantitatively sound but also visually accessible and compelling: a relatively complex data visualization.
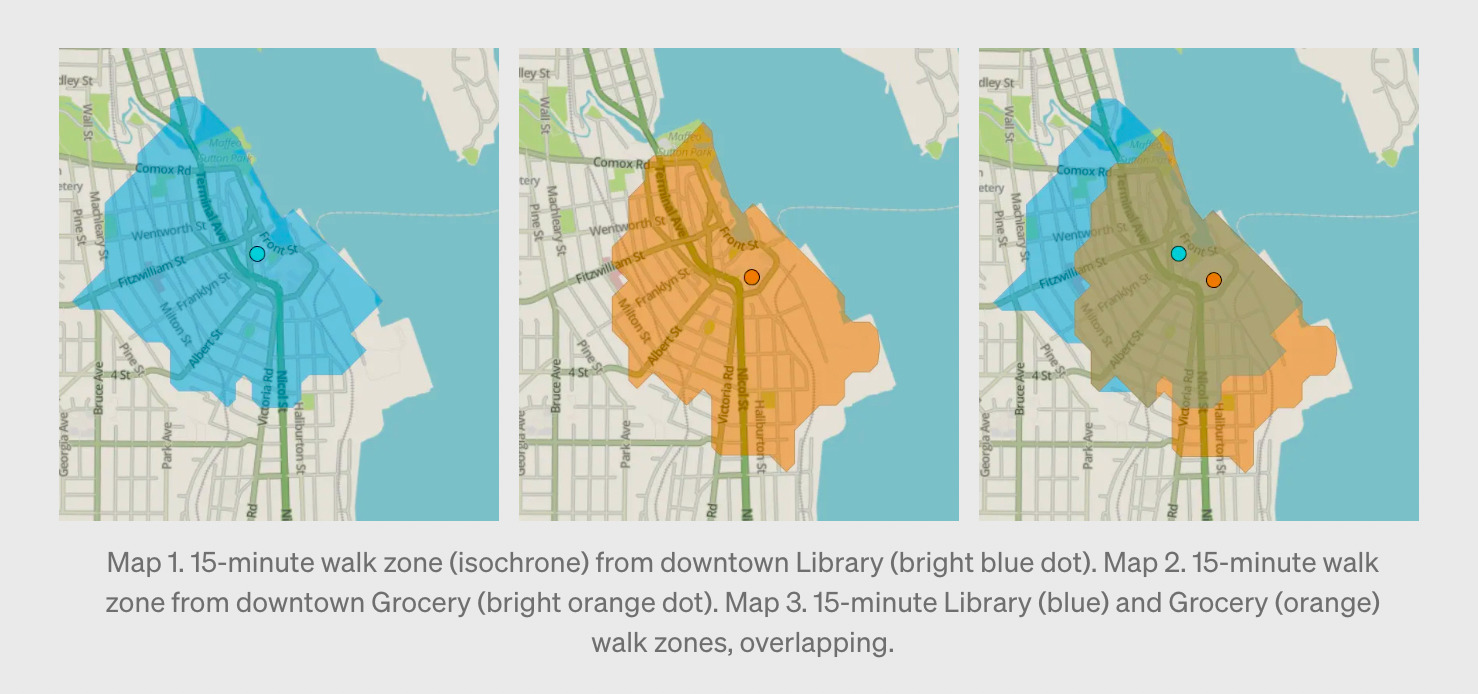
⏳ Creating isochrone maps
Robert’s overlapping isochrone approach required creating a list of amenities, scraping their locations, dropping their latitudes and longitudes into mapping software, and defining 15-minute isochrone intersection zones.
After some research, Robert landed on Apify’s Google Maps Scraper to perform text-based searches for and extract geolocation data for groceries, pharmacies, recreational spaces, libraries, museums, theaters, restaurants, pubs, cafes, but also daycares, public schools, foodbanks, and walk-in clinics.
Robert then used QGIS, an open-source mapping tool, to create isochrone maps around amenities and define zones of overlap – places one could live and have 15-minute walking access to all the amenities they need.
🌳 More research – more questions
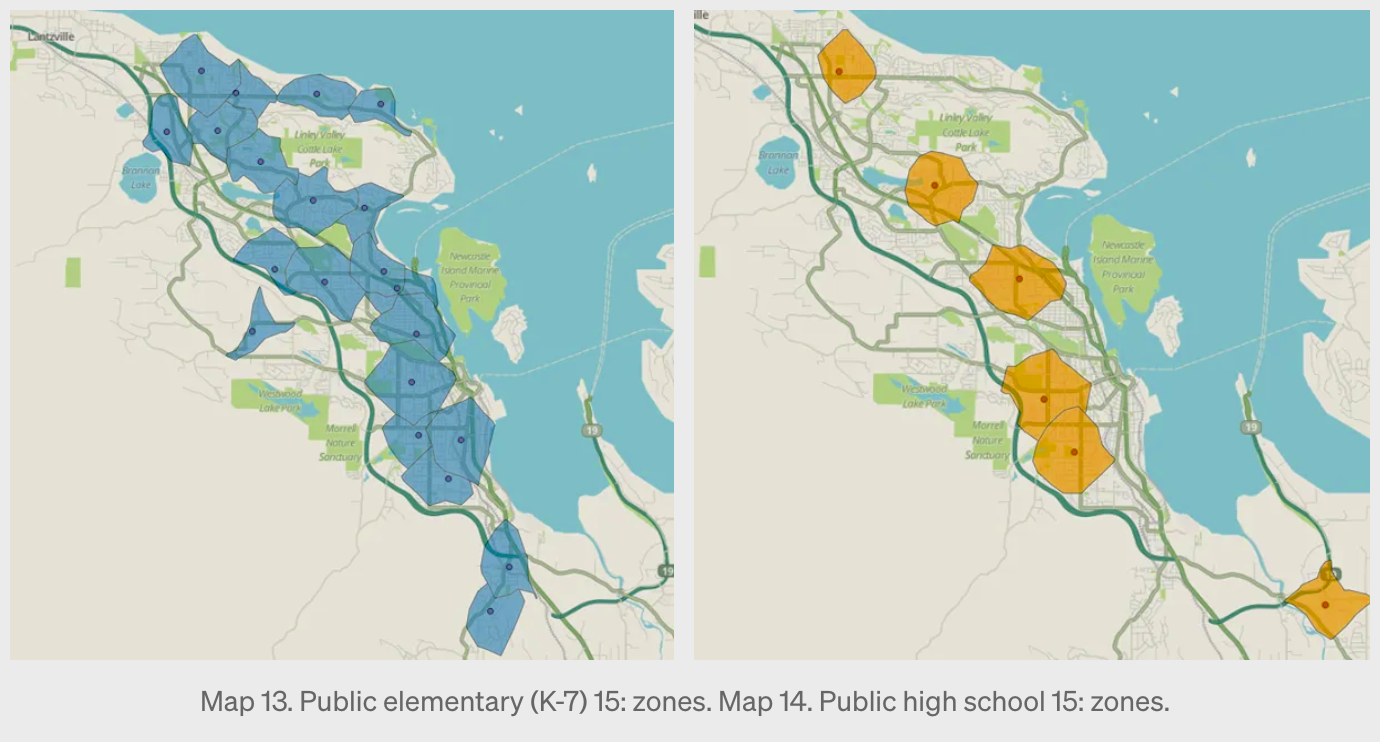
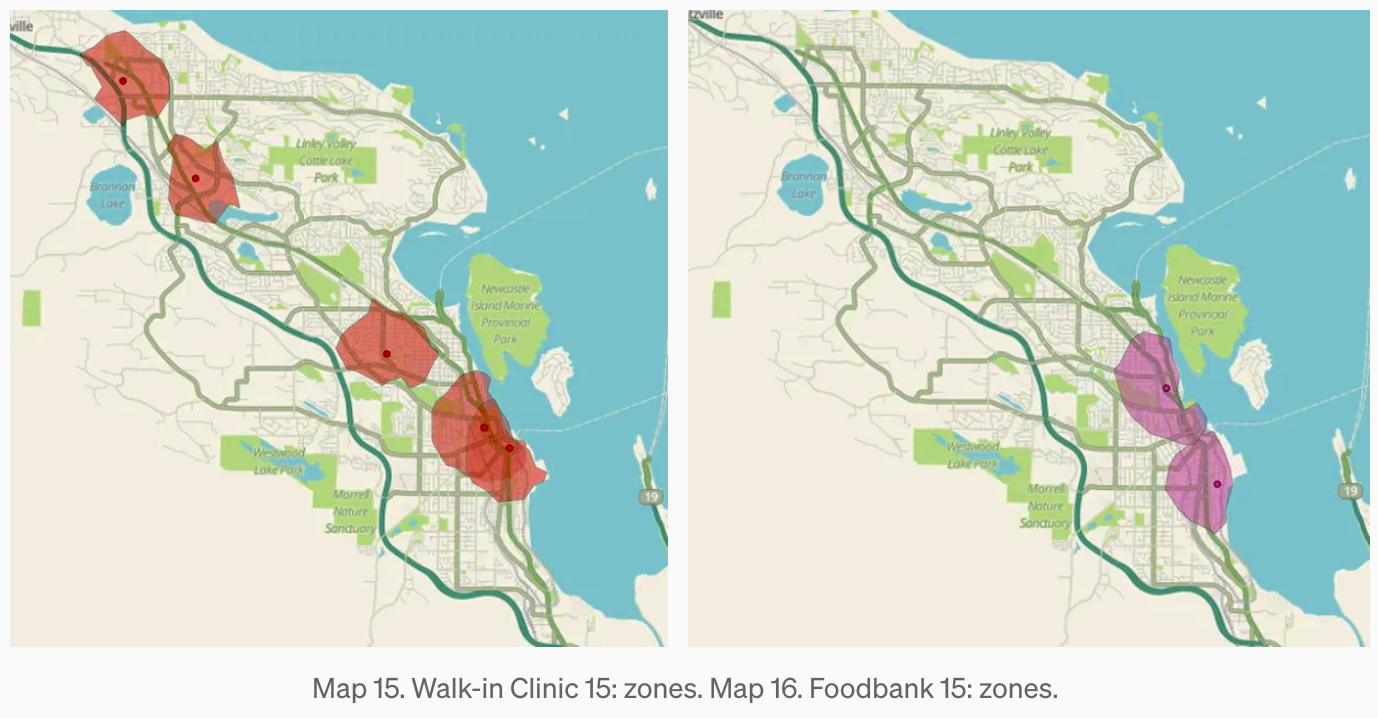
But the research didn’t end at just counting how much time it takes to get from point A to point B. Choosing the list of amenities immediately posed the question of what amenities should be considered essential, what amenities were prerequisite to enjoying a basic quality of life. Not all people have the same needs. Some people need access to food banks and walk-in clinics. Some need access to supportive housing. Others need access to daycare and schools for their children. Different people, then, have different zones where they can live and have 15-minute walking access to everything they need. Certain patterns – and new questions – emerged from Robert’s maps:
🌳 How widespread and where are specific amenities? Recreational areas, restaurants, pubs and fast food, for example, are available throughout the city. There are far fewer pharmacies, walk-in clinics, food banks, and supportive housing.
👨👦 What if a resident has daily caretaking responsibilities? Daycares are concentrated centrally and to the south, public elementary schools are widespread, while high schools are more sparsely distributed.
💰 Who can afford to live in 15-minute walkable areas? What’s the median income level of people living in Nanaimo’s 15-minute neighborhoods?
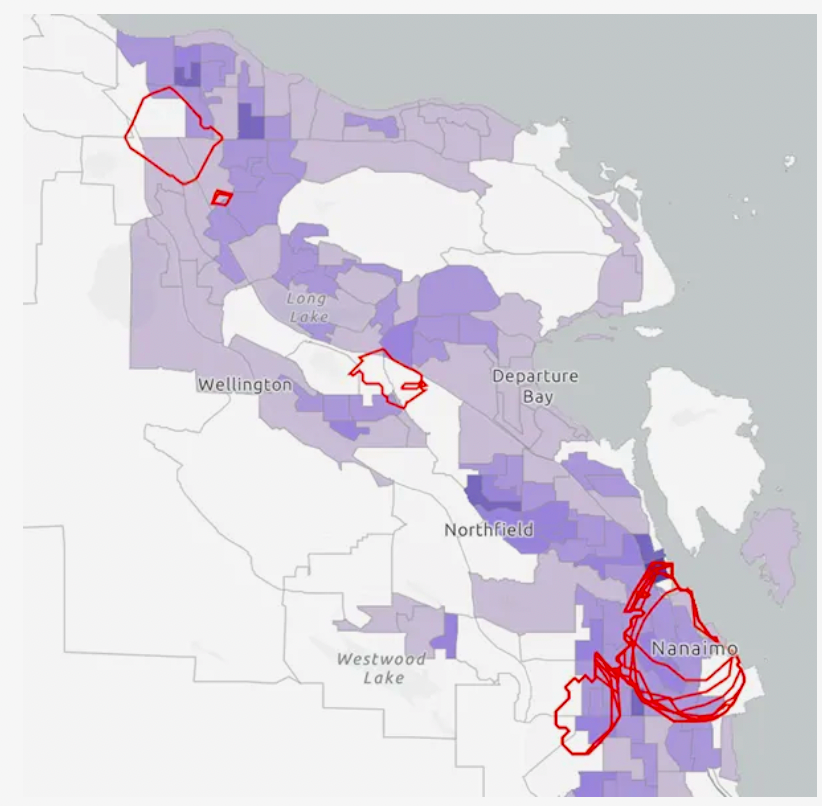
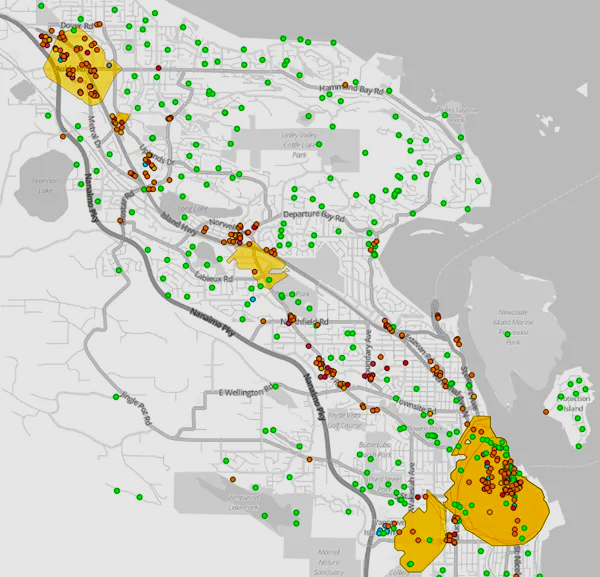
Map 1: Essential-basic 15: zone outlines (red for contrast visibility) overlaid on population density map Map 2: Essential and basic quality of life amenities by location, compared to our three general 15: zones
🤔 Geomapping conclusions
Some outcomes of Robert’s walkability analysis were unsurprising. Survey and WalkScore data already indicated Nanaimo is a car dependent city with low walk, bicycle, and public transit scores. Less immediately obvious, perhaps, is the fact that car dependent cities tend to concentrate amenities in places with low population densities, like malls, meaning that although these zones provide 15-minute walking access to essential amenities, very few people live within 15 minutes walk of them.
Learn how to do web scraping on Google Maps for data visualization project
Robert’s interest in Moreno’s 15-minute city concept stemmed partly from his own experience living in various cosmopolitan cities around the world. Clearly, different population densities and histories lead to different attitudes toward public space. Europeans seem to be more accustomed to sharing, investing in, and utilizing public spaces, while North Americans tend to prioritize suburban living and private space. These broader differences may be more difficult to alter in the short term. But cities that are interested in becoming more walkable and convenient should consider zoning to increase residential density near amenities, amenities near residential density, and amenity-residential density in areas lacking both. In other words, they should embrace a more European model of the city, with walking and convenience as the focus.
Robert’s research demonstrates the power of quantitative data in understanding and suggesting improvements in the urban environment. His approach could easily be applied in studies of walkable amenity-access in other cities around the world. Robert’s hope is that his findings can contribute to a larger conversation between people who care about the future of humans in the built environment.


