Content
What can you do if you don’t want to miss a change?
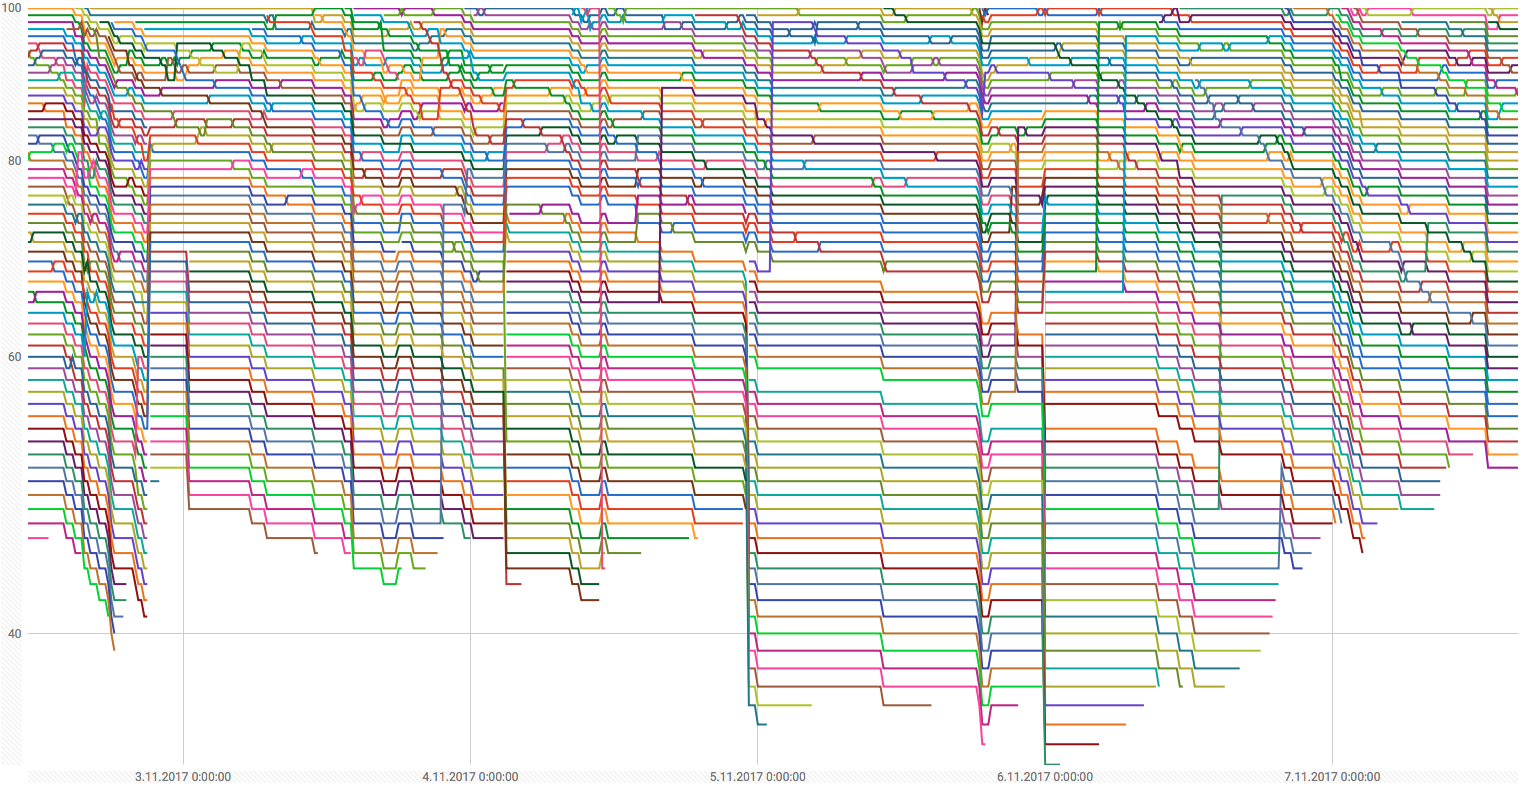
Looking at an ever changing website from Hacker News Show, we can begin to see the information we are losing by not constantly monitoring. There are few posts per hour and then each post is going up and down based on its popularity and some blackbox magic. It would be cool to visualize the flow of the posts to see the trends.
As I am working for Apify I will use our platform :). I will combine 2 services
- Crawler — to scrape the data from HN Show every 15 minutes
- Actor — to merge new data with previous one after each crawler run
First we will create a crawler that scrapes the HN Show and returns following JSON where each link has a rank from 1 to 100 (from the lowest to the highest position):
The crawler is available here https://www.apify.com/mtrunkat/okmkW-api-news-ycombinator-com and its configuration contains only two attributes — http://news.ycombinator.com/show as the Start URL
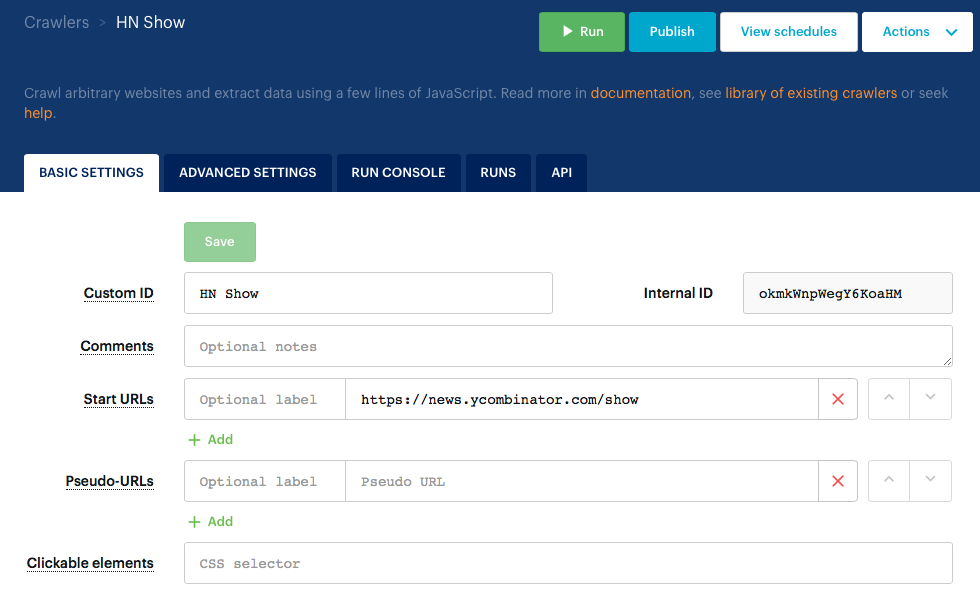
and the following Page function to scrape the data:
Then we need to setup a scheduler with cron expresssion */15 * * * * to execute our crawler every 15 minutes.
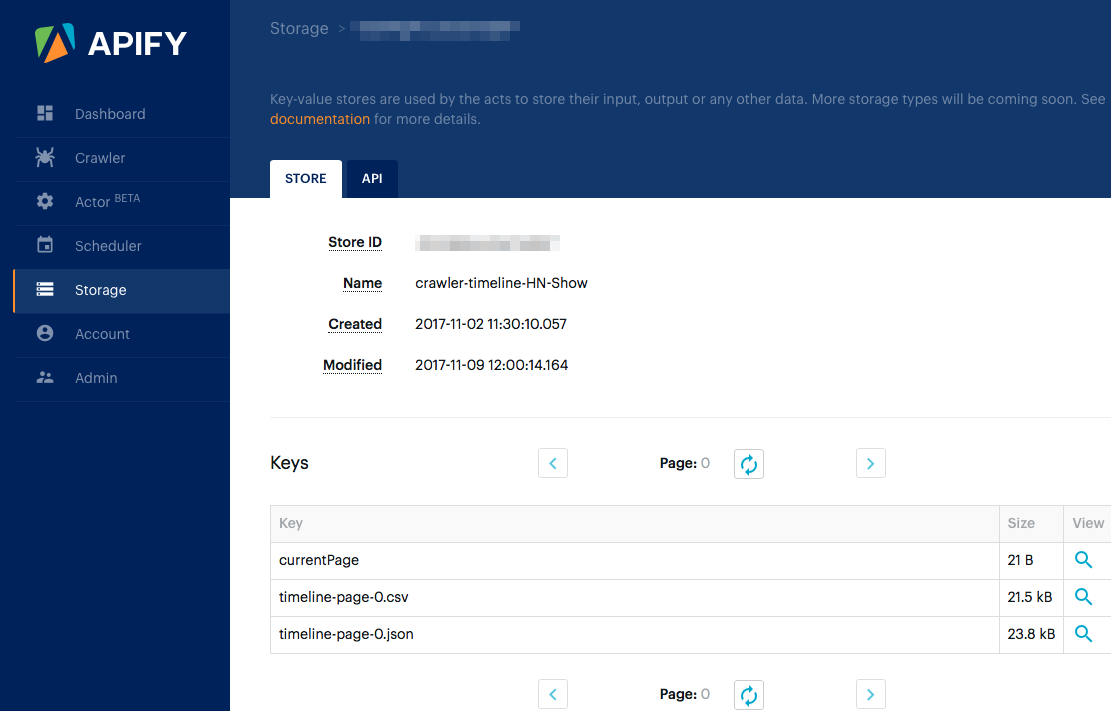
Finally, to collect the data from each crawler run, we initiate the start of mtrunkat/crawler-timeline act from the finish webhook of our crawler. This act simply takes the result of the last crawler execution and adds it as a new line to previous ones. Outputs are saved into a key-value store in the user’s account in CSV and JSON formats:
Here is the final dataset imported to Google Spreadsheet: https://docs.google.com/spreadsheets/d/1hYmN49rdGpH_UQkH-hK7Jdtd5q2Emie5_YdRV8E5UyM/edit?usp=sharing
If we wait for a few days for the crawler to collect data (a phenomenon called web scraping in 2024), then we will be able see the visualization of flow of the HN Show posts from the beginning of this article.
This way you can monitor product prices on e-commerce sites, current stock prices, occupancy of your favorite public pool, you name it. Apify’s different services allow for you to harness the insight of the Web to any project you can dream of.